
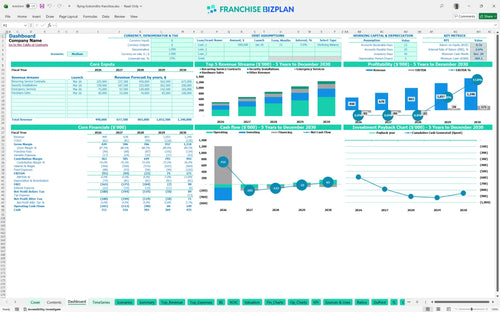
All-in-one Dashboard
Core inputs and core outputs


This comprehensive toolkit includes a dynamic Excel template for franchise unit operating expenses, detailed multi-year revenue drivers, and a capital expenditure planner for your mobile fleet.
Core inputs and core outputs
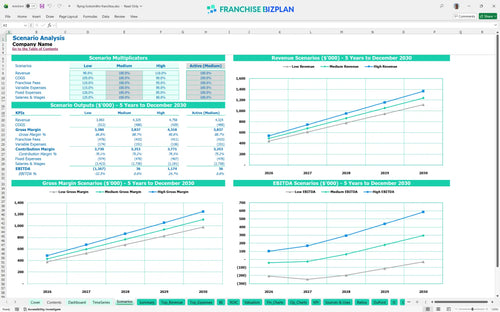
Three scenario analysis
Presentation ready
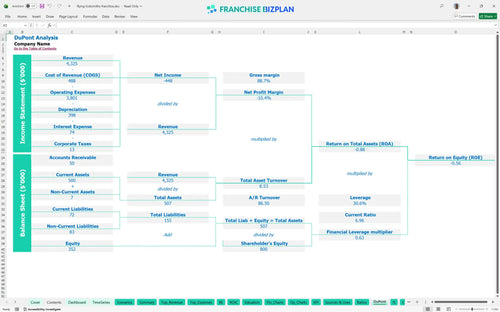
DuPont analysis
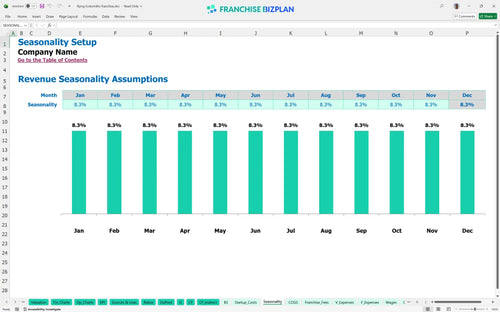
Researched revenue assumptions
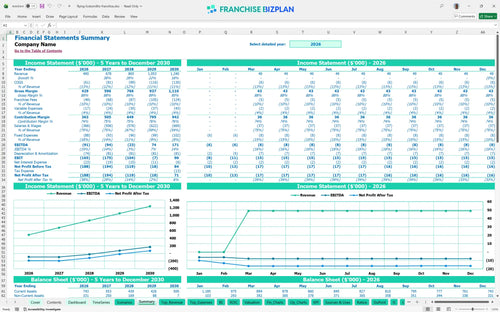
Lender-friendly financial outputs
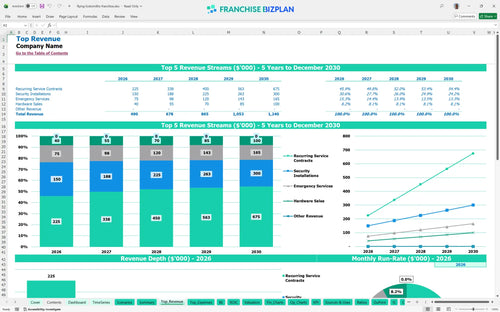
Revenue stream detailed view
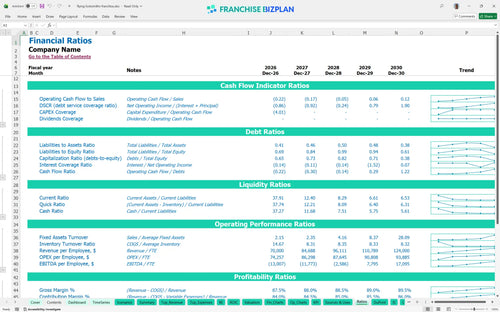
Performance metrics benchmark
We built this franchise unit financial model using our own research to ensure it reflects the actual costs of running a professional security and locksmith operation. Key assumptions like the $405,000 initial CAPEX and the 8% royalty fee are pre-populated and fully editable to match your specific market. With a projected Year 5 EBITDA of $171,000, this model helps you bridge the gap between a business idea and a functional financial plan.
The unit reaches positive EBITDA in Year 4, generating approximately $74,000 in earnings after all operating costs. While Year 1 starts with a $91,000 loss during the ramp-up, the model shows a clear path to a 13.7 percent net margin by Year 5 as revenue hits $1.24M.
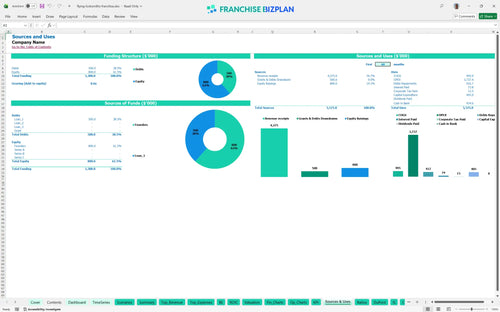
You need approximately $405,000 in initial capital to cover the core startup costs, plus an additional cash buffer for the first three years of operations. The primary uses of funds include the franchise fee, your mobile service fleet, and specialized tools required for high-tech security work.
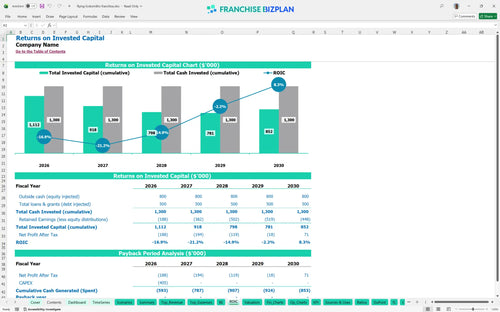
The ROI analysis for locksmith service business shows an IRR of -2.61% over the initial five-year period, with the payback period extending beyond the fifth year. This reflects the heavy upfront investment in vehicles and the long ramp-up time required to build a commercial client base.
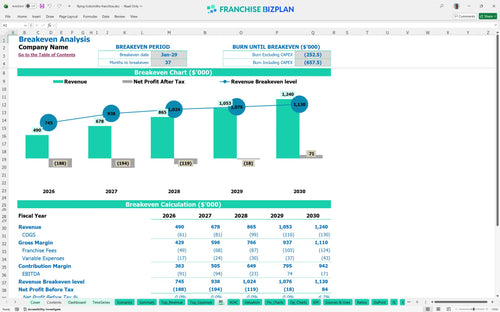
The unit hits the monthly break-even point in January 2029, roughly 37 months after launching. The primary driver for reaching this milestone is the volume of recurring service contracts, which must scale to offset the high fixed costs of a $5,000 monthly rent and a $345,000 annual management payroll.
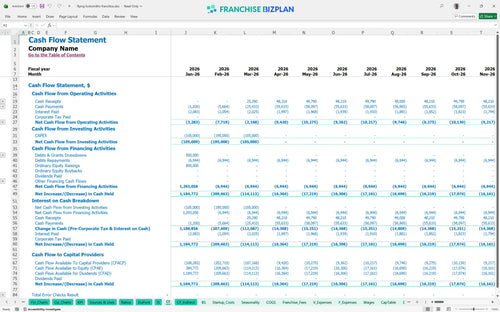
The lowest cash point occurs in December 2029, with a minimum cash balance of $369,000. You will defintely need to maintain a significant liquidity reserve through Year 3, as the business experiences cumulative EBITDA losses of $208,000 before the bottom line turns positive in Year 4.
The franchise financial performance representation template shows that a High-growth scenario accelerates profitability by 12 months, while a Low-growth scenario could deplete the $369,000 cash buffer. Small changes in the 10% combined royalty and marketing fee significantly impact the Year 1 EBITDA loss of $91,000.
This franchise financial model template provides a flexible Excel environment where you can adjust every variable of your locksmith operation. All formulas are pre-built to handle complex calculations, but the assumptions for your specific territory, local labor rates, and rent are yours to control. It is designed to help you move from a generic business plan to a precise, location-specific roadmap for a service-based business.

Success in the security industry requires looking past the first year of van wraps and tool purchases. This service business financial projection maps out 60 months of performance, showing how revenue scales from $490,000 in year one to $1,240,000 by year five. It provides the long-term visibility needed to manage cash flow through the initial ramp-up phase and into sustained profitability.

The model simplifies the franchise royalty fee calculation by automatically applying the 8% royalty and 2% marketing fund contribution against your gross sales. This ensures you see the true net impact of brand overhead on your unit economics analysis before you ever sign a lease. Understanding these fixed percentages is vital because they represent a $124,000 annual cost at the $1.24M revenue mark.

Launching a mobile security business involves significant upfront capital, from the $75,000 franchise fee to the $150,000 fleet investment. This franchise startup cost spreadsheet aggregates these figures to show your total entry price and uses a break-even point calculator to determine exactly when your monthly volume covers your fixed costs. It helps you visualize the 37-month journey to the break-even date in January 2029.

We integrated locksmith-specific benchmarks to help you perform a realistic franchise profitability analysis. The model includes researched targets for hardware costs, which start at 11% of sales, and technician labor, which scales as you grow from two to five techs. These guardrails prevent you from being too optimistic in your startup budget spreadsheet for professional service franchises.


Simply purchase and download the financial model template, then access it instantly using Microsoft Excel or Google Sheets. No installation or technical expertise required-just open and start working.

Enter your business-specific numbers, including revenue projections, costs, and investment details. The pre-built formulas will automatically calculate financial insights, saving you time and effort.

Leverage the investor-ready format to confidently showcase your financial projections to banks, franchise representatives, or investors. Impress stakeholders with clear, data-driven insights and professional reports.

Leverage the investor-ready format to confidently present your projections to banks, franchise representatives, or investors.