
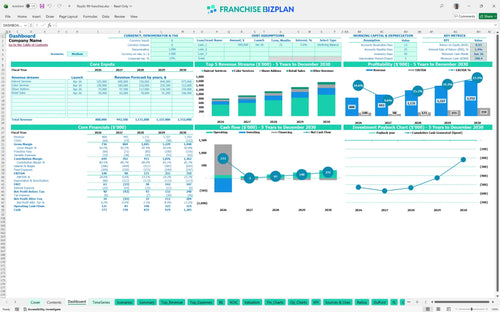
All-in-one Dashboard
Core inputs and core outputs


This franchise unit financial model template provides a complete roadmap for projecting revenue, managing labor costs, and calculating long-term ROI for a grooming business.
Core inputs and core outputs
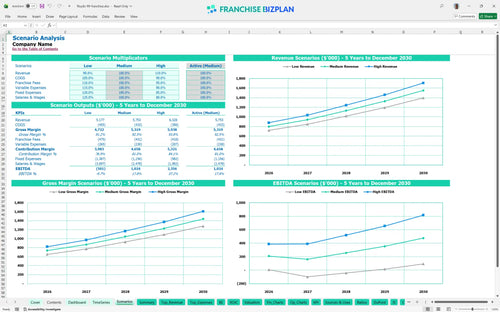
Three scenario analysis
Presentation ready
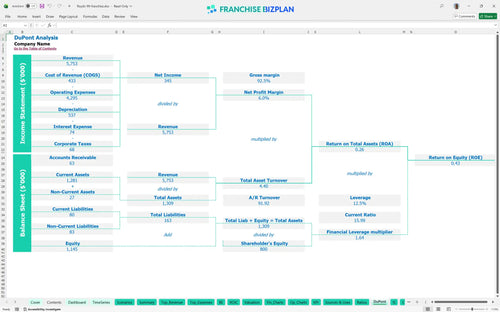
DuPont analysis
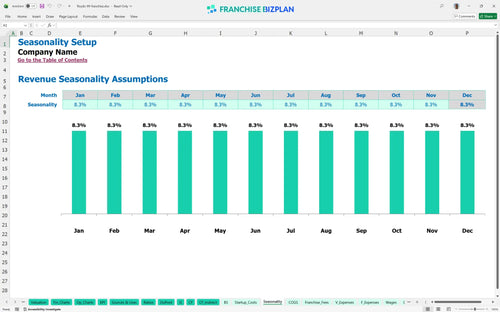
Researched revenue assumptions

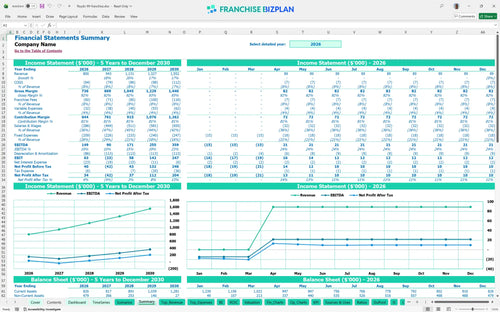
Lender-friendly financial outputs
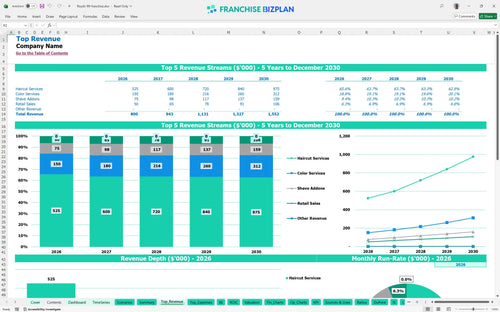
Revenue stream detailed view
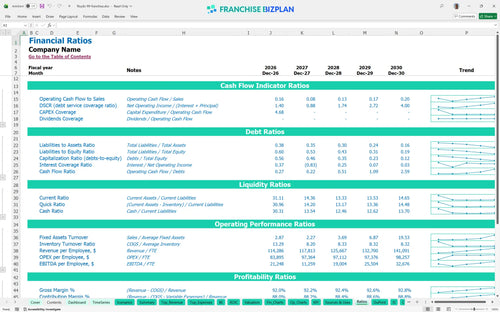
Performance metrics benchmark
We built this franchise unit financial model using our own research to ensure it reflects the actual costs of a high-end grooming shop. Key assumptions like the $350,000 Year 1 haircut revenue and the $13,000 monthly rent are pre-populated and fully editable. This tool helps you dive into a franchise unit profitability analysis with confidence, using real metrics like the 1.4% IRR to guide your investment decision.
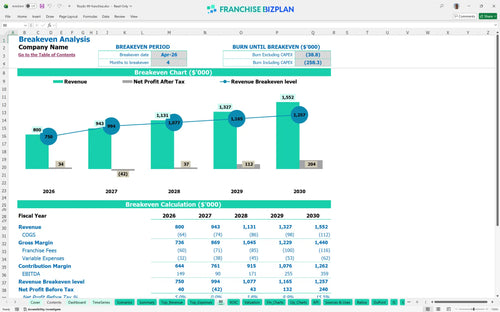
You can expect to hit monthly break-even by April 2026, just four months after launching the shop. While Year 1 shows a healthy $149,000 EBITDA, Year 2 dips to $90,000 as you scale staff, before climbing steadily to $359,000 by Year 5. Profitability depends heavily on balancing the 6% royalty with high-margin services like color and shaves. This hair salon franchise financial projections model tracks that trajectory clearly.
Total initial investment is substantial, requiring a minimum cash position of $700,000 to cover build-out and early losses. The largest capital outlays include $250,000 for leasehold improvements and $100,000 for barber chairs and stations. You also need to budget for the $49,500 franchise fee and $30,000 in initial inventory to stock the retail shelves before opening day. This is the core of your barbershop franchise startup costs assessment.
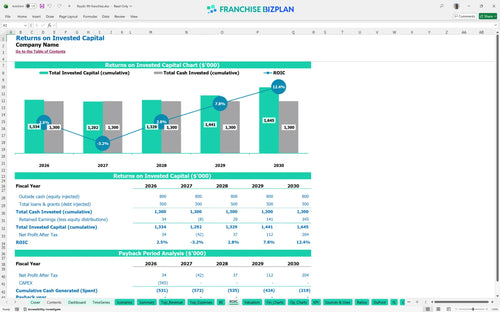
The model shows an Internal Rate of Return (IRR) of 1.4% and a Return on Equity (ROE) of 0.43 over the first five years. Full payback of the initial investment occurs after Year 5, which is common for high-CAPEX retail grooming builds with significant leasehold costs. While the early years focus on recouping the $250,000 build-out, the Year 5 EBITDA of $359,000 suggests strong long-term cash flow potential. This ROI calculation is critical for any franchise investment assessment.
You reach the break-even date in April 2026, meaning the shop covers its $13,000 monthly rent and base salaries within the first quarter. The primary driver for hitting this goal is service volume, specifically reaching $350,000 in annual haircut revenue. If labor costs for your four initial barbers exceed the planned percentage of sales, the break-even timeline will defintely slide. This break-even analysis is the heartbeat of your monthly operations.
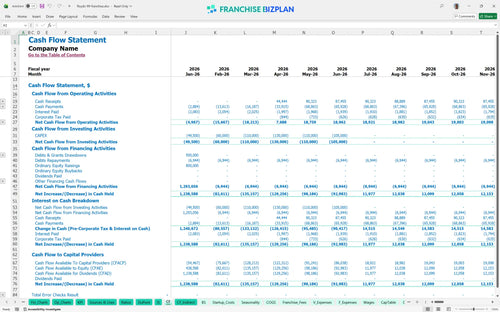
Your lowest cash point occurs in June 2026, with a minimum cash requirement of $700,000 to stay liquid during the ramp-up. This period is tight because you are finishing the $250,000 build-out while paying for $30,000 in initial inventory. Maintaining a cash buffer is essential to handle the $13,000 monthly rent before the shop reaches full capacity. A salon franchise cash flow projection spreadsheet helps you visualize this runway clearly.
The difference between a Low and High scenario often comes down to throughput (the speed of service delivery) and retail sales. In a High case, hitting $1.55 million in Year 5 revenue significantly improves your 1.4% IRR and shortens the payback. Conversely, a Low case where revenue stays near the $800,000 Year 1 mark would extend the payback period well beyond five years. Analyzing franchise unit performance metrics across these scenarios prepares you for any market shift.
This franchise unit financial model lives in Excel, giving you total control over every line item from chair count to local wage rates. We've pre-loaded it with researched formulas and editable assumptions so you can stress-test different scenarios for your specific territory. It is a flexible franchise financial model template designed to handle the nuances of a high-volume grooming shop.

Planning for a single shop or a multi-unit cluster requires a multi-year view of how cash moves through the business. This model projects five years of performance, showing revenue scaling from $800,000 in Year 1 to over $1.5 million by Year 5. It tracks the full P&L (Profit and Loss statement) so you can see how margins evolve as you add barbers and stylists to meet demand. Using this for a salon franchise business plan ensures your growth strategy is backed by hard numbers.

Operating under a brand means fixed financial commitments that eat into your store-level margin before you pay your own rent. This tool calculates the 6% royalty and 1.5% marketing fund contributions automatically based on your gross sales. By mapping these out early, you can see exactly how much goes to the franchisor, which is vital for understanding franchise royalty fees and operational overhead in a retail environment.

Launching a high-end grooming shop involves significant upfront capital, including a $49,500 franchise fee and $250,000 in leasehold improvements. This model identifies your total startup investment and calculates the monthly revenue needed to cover fixed costs like the $13,000 Aldrich Street rent. Knowing your break-even point helps you manage the critical first few months of operation when cash is tightest. It simplifies how to calculate startup costs for a hair salon franchise without the guesswork.

We include industry-standard benchmarks for labor and occupancy to help you verify if your projections are realistic for the grooming sector. For instance, if your barber wages exceed the typical percentage of service revenue, the model flags it for review. This allows you to compare your $1,800 utility budget or $400 POS (Point of Sale) software costs against what other successful operators are seeing. It is an essential tool for evaluating profitability of retail grooming franchises against the broader market.


Simply purchase and download the financial model template, then access it instantly using Microsoft Excel or Google Sheets. No installation or technical expertise required-just open and start working.

Enter your business-specific numbers, including revenue projections, costs, and investment details. The pre-built formulas will automatically calculate financial insights, saving you time and effort.

Leverage the investor-ready format to confidently showcase your financial projections to banks, franchise representatives, or investors. Impress stakeholders with clear, data-driven insights and professional reports.

Leverage the investor-ready format to confidently present your projections to banks, franchise representatives, or investors.