
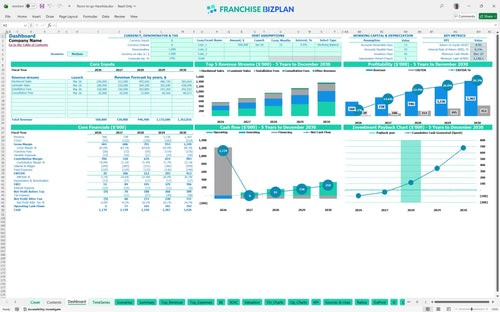
All-in-one Dashboard
Core inputs and core outputs


This comprehensive toolkit provides a detailed flooring franchise business model and financial forecast to help you navigate the first 60 months of retail operation.
Core inputs and core outputs
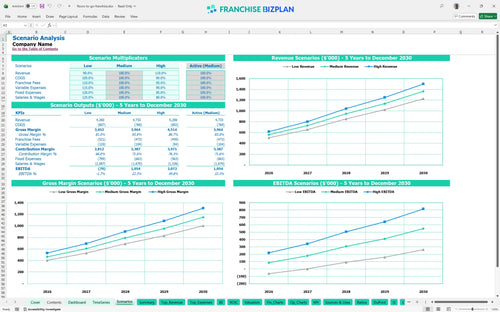
Three scenario analysis
Presentation ready
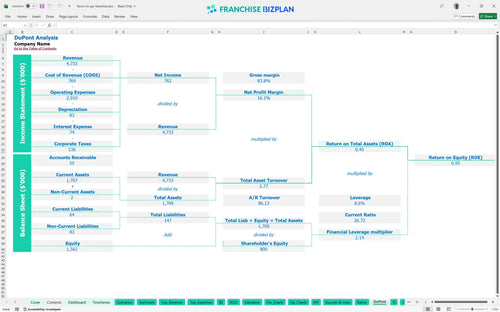
DuPont analysis
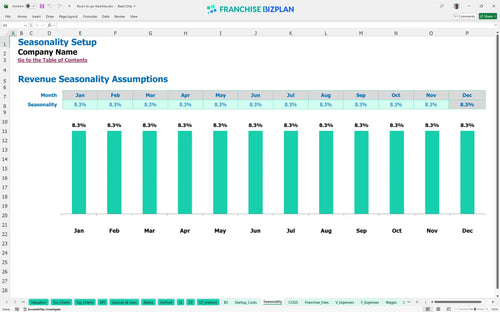
Researched revenue assumptions
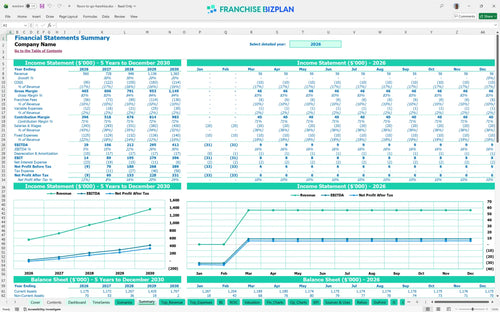
Lender-friendly financial outputs
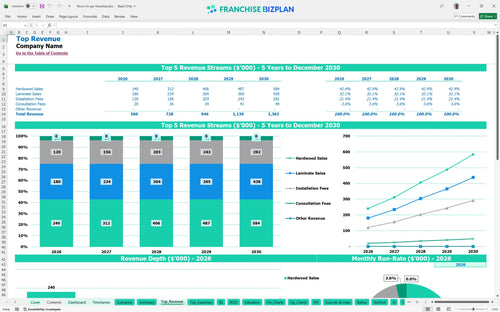
Revenue stream detailed view
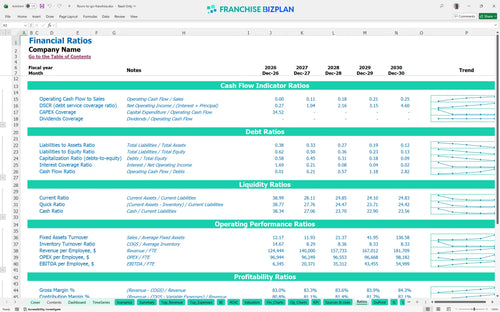
Performance metrics benchmark
We built this flooring franchise financial model using detailed research on retail operations to give you a head start. The template includes pre-populated data for revenue streams like hardwood and laminate sales, plus specific costs like the $18,000 mobile showroom vehicle investment. It is a pragmatic look at how a unit scales from a $29,000 Year 1 EBITDA to a more robust $412,000 by Year 5.
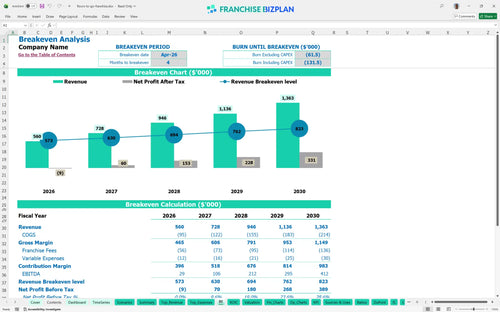
You can expect to hit the break-even point by April 2026, just four months after launching your store. While Year 1 EBITDA is modest at $29,000, the model shows a sharp climb as your local reputation and designer referral networks mature over the first 36 months.
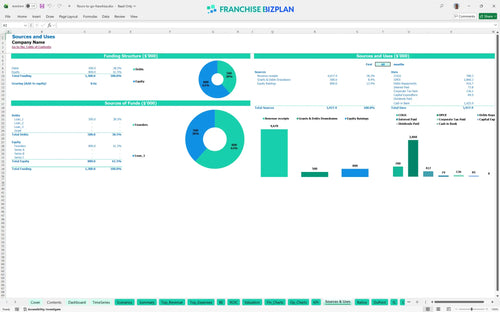
Total initial capital expenditure is approximately $84,900, covering everything from the $10,000 franchise fee to $25,000 for leasehold improvements. You will also need to fund the $18,000 mobile showroom vehicles which are essential for your white-glove home consultation service and local market reach.
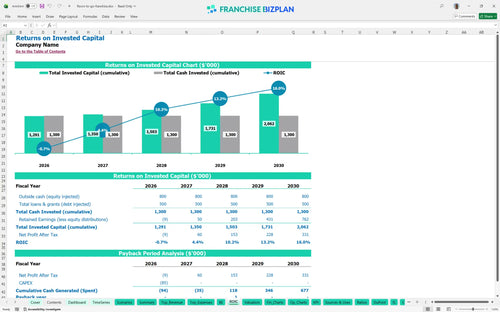
This flooring store investment analysis spreadsheet shows an Internal Rate of Return (IRR) of 6.1% with a full payback period of 3 years. With a Return on Equity (ROE) of 0.95, the model demonstrates a stable path for investors looking for retail exposure in high-growth residential corridors.
Monthly break-even occurs in month 4, driven primarily by your ability to move $160,000 in hardwood sales in your first year. Your $5,800 monthly rent is your largest fixed hurdle, so maintaining high showroom traffic is the fastest way to cover your operational expense budgeting.
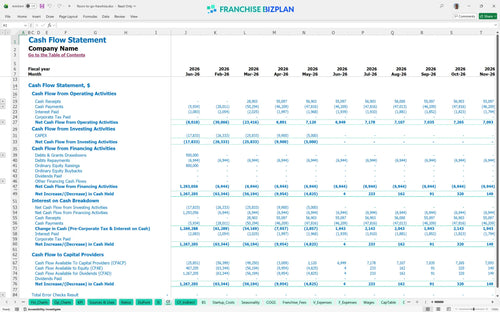
The lowest cash point hits in December 2027, meaning you need to manage your working capital carefully during the transition into your second full year. A cash buffer is recommended to handle the timing gap between paying for inventory and collecting final installation fees from customers.
A High scenario assumes better conversion on consultation fees, which significantly shortens the 3-year payback period. Conversely, a Low scenario with higher COGS-above the projected 13.8%-could delay your April 2026 break-even and increase your peak cash need during the ramp-up phase.
Finance: update unit break-even and payback model by Friday
This Excel-based tool allows you to swap out assumptions for your specific territory and operating reality. Whether you are adjusting hardwood sales volume or local labor rates, the pre-filled formulas handle the heavy lifting so you can focus on strategy. It is built for the operator who needs to see how a 5% shift in installation fees changes the bottom line without breaking the spreadsheet.

You need to see past the grand opening to understand long-term viability. This model projects five years of performance, showing revenue scaling from $560,000 in year one to over $1.3 million by year five. It maps out the path from initial ramp-up to mature-unit stability, giving you a clear view of your long-term return on investment calculation and future cash flow.

Royalties and brand funds are non-negotiable costs that impact your store-level margin every single month. We have baked in a 4% royalty and a 6% marketing fee to ensure your unit economics reflect the true cost of being part of a national brand. Understanding how these fees interact with your $5,800 monthly rent is vital for maintaining a healthy franchise royalty structure.

Launching a showroom requires significant upfront capital for leaseholds and interactive displays before the first customer walks in. This franchise startup cost template aggregates your initial $10,000 franchise fee with build-out costs like the $25,000 leasehold improvements. It defintely helps you pinpoint the exact revenue needed to cover your fixed overhead and variable supplies.

Do not guess on your margins when you can use researched data. The model includes industry-standard ranges for flooring inventory costs, which start around 13.8% of sales in the first year. Comparing your projected labor spend against these benchmarks ensures your flooring business plan Excel remains grounded in operational reality rather than just best-case scenarios.


Simply purchase and download the financial model template, then access it instantly using Microsoft Excel or Google Sheets. No installation or technical expertise required-just open and start working.

Enter your business-specific numbers, including revenue projections, costs, and investment details. The pre-built formulas will automatically calculate financial insights, saving you time and effort.

Leverage the investor-ready format to confidently showcase your financial projections to banks, franchise representatives, or investors. Impress stakeholders with clear, data-driven insights and professional reports.

Leverage the investor-ready format to confidently present your projections to banks, franchise representatives, or investors.