
All-in-one Dashboard
Core inputs and core outputs


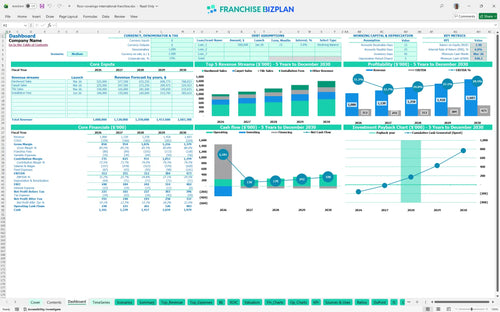
This comprehensive financial tool provides a research-backed framework for projecting revenue, managing operating expenses, and calculating the total return on investment for a mobile flooring franchise unit.
Core inputs and core outputs
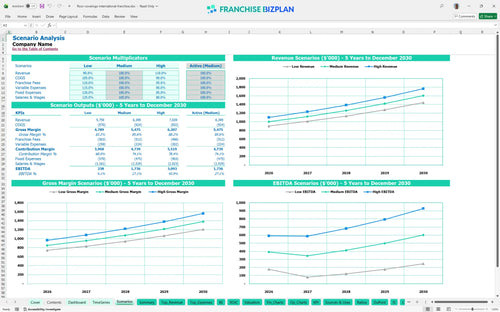
Three scenario analysis
Presentation ready
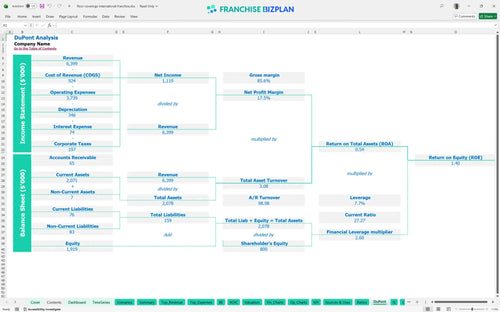
DuPont analysis
Researched revenue assumptions
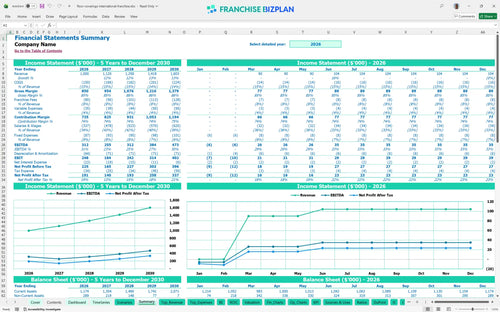
Lender-friendly financial outputs
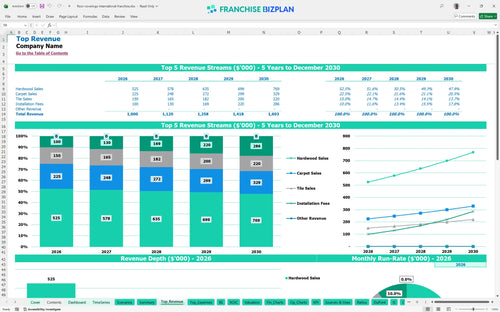
Revenue stream detailed view
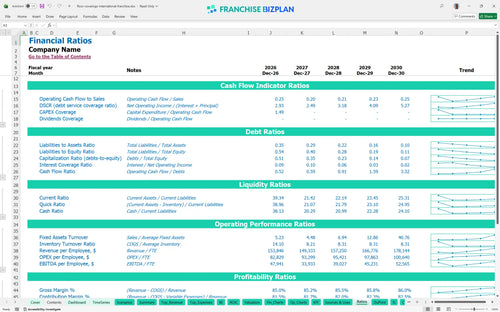
Performance metrics benchmark
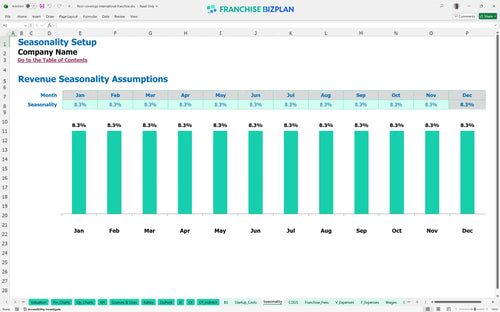
We built this franchise unit financial model using our own research to provide a financial planning guide for new franchise owners. Key assumptions, including revenue streams like hardwood and tile sales, operating expenses, and the 8% combined royalty and marketing fees, are pre-populated with researched data and are fully editable. Year 1 revenue is projected at $1,000,000 with a healthy $312,000 EBITDA, providing a realistic baseline for your territory planning.
Home services franchise profitability begins almost immediately, with the unit showing a positive EBITDA of $312,000 in its first full year. While Year 2 sees a slight dip to $255,000 as you scale staff and add a driver coordinator, the trajectory climbs steadily to $473,000 by Year 5. Growth often costs more before it pays more, but the long-term margins remain strong as you optimize your installation teams.
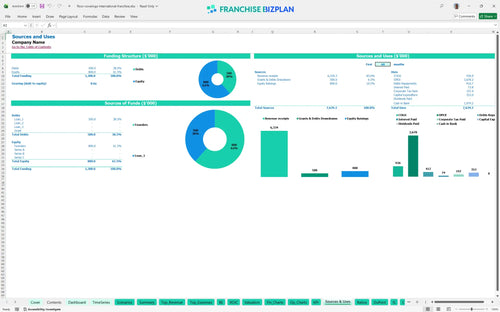
To understand how to calculate startup costs for a mobile flooring franchise, you must account for the $353,000 in initial capital expenditure. This covers the startup capital requirements for residential flooring franchise units, including two mobile showrooms and the initial $53,000 franchise fee. Equipment is your biggest upfront hurdle, but it serves as your primary revenue generator and rolling billboard.
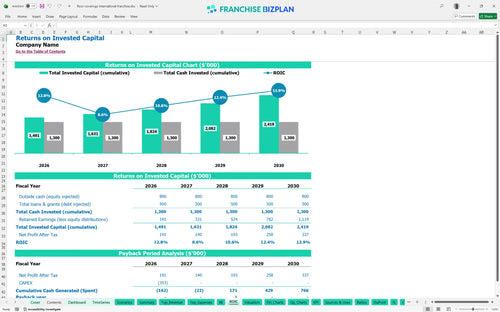
Investors can expect an Internal Rate of Return (IRR) of 6.05% and a Return on Equity (ROE) of 1.4 over the initial five-year period. The Excel template for franchise investment return analysis shows a 3-year payback period, which is a standard window for recovery in asset-heavy mobile businesses. This ROI analysis assumes you hit your revenue targets through consistent local marketing and high-quality installations.
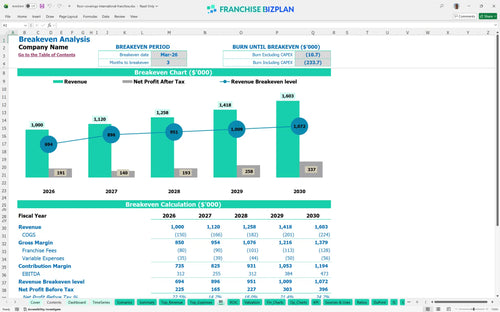
The unit reaches its monthly break-even point in March 2026, just three months after the initial setup phase begins. Evaluating profitability of mobile flooring business models shows that volume is the primary driver, as fixed costs like the $3,500 showroom lease and $1,200 commercial insurance must be covered by job margin. Volume solves most margin headaches when your fixed overhead is relatively stable.
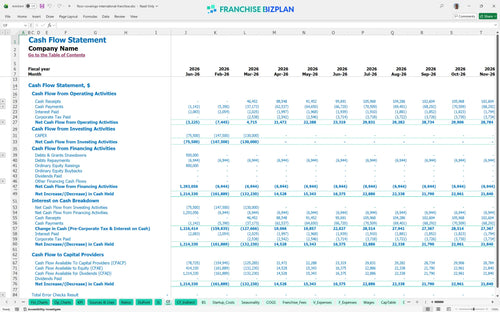
The lowest cash point occurs in March 2026, coinciding with the break-even date, with a minimum cash balance of $920,000. This suggests a significant liquidity buffer is maintained to handle the ramp-up of the $277,000 annual installer payroll and marketing expenses. Cash is oxygen during the launch phase, and having a three-month runway ensures you can weather any initial delays in project completions.
Estimating profit margins for mobile showroom businesses requires looking at how a 10% shift in sales impacts your Year 1 margin. In a high-growth scenario, increased installation fees and hardwood sales accelerate the 3-year payback, while a low-revenue scenario might extend the payback period by 12-18 months. High performance requires high-touch marketing and a relentless focus on the $55 average ticket or project value.
Finance: update unit break-even and payback model by Friday.
This franchise financial model is built in Excel, allowing you to tweak every lever from material markups to installer pay rates. You can adjust the pre-filled formulas to reflect your specific territory, ensuring the neccessary flexibility for a mobile showroom operation. It is a plug-and-play tool for any serious operator. Using this flooring franchise unit financial forecasting excel, you can modify revenue drivers like hardwood and carpet sales to see how they impact your bottom line in real-time.

Long-term visibility prevents expensive surprises by mapping out your growth from a single van to a multi-vehicle fleet. This financial model template for home improvement franchises provides detailed franchise unit financial projections, covering revenue, costs, and cash flow through 2030. It is a vital franchise business plan template for anyone looking to understand how Year 5 revenue of $1,603,000 compares to the initial ramp-up phase. Seeing the five-year horizon helps you plan for equipment replacement and staff expansion before they become urgent needs.

Fees are the price of brand power, and this model tracks them with precision to show your true store-level margin. We include a franchise P&L statement template for small business owners that automatically calculates the 5% royalty and 3% marketing fund contributions based on your monthly sales. By analyzing franchise unit operating costs and revenue, you can see exactly how much cash stays in your pocket after the franchisor takes their cut. This ensures you are never surprised by the monthly bill for brand support and proprietary software access.

Calculating flooring franchise startup costs requires looking at both the $53,000 franchise fee and the heavy equipment like the $95,000 mobile showroom. Our break-even analysis shows you exactly how many hardwood or carpet jobs you need to book to cover your $3,500 monthly lease and $7,000 in monthly wages. Speed to market is everything in home services, so knowing your monthly fixed cost floor is critical for survival. This section helps you visualize the sales volume neccessary to move from burning cash to generating profit.

Don't fly blind without industry standards to guide your spending on labor and materials. The model incorporates franchise unit performance metrics that allow you to compare your 12% material cost and 3% installation supply expense against typical home improvement ranges. This sanity check ensures your pricing strategy is competitive while protecting your store-level EBITDA (earnings before interest, taxes, depreciation, and amortization). It is the easiest way to spot margin leaks in your vehicle fuel maintenance or payment processing fees before they erode your annual returns.


Simply purchase and download the financial model template, then access it instantly using Microsoft Excel or Google Sheets. No installation or technical expertise required-just open and start working.

Enter your business-specific numbers, including revenue projections, costs, and investment details. The pre-built formulas will automatically calculate financial insights, saving you time and effort.

Leverage the investor-ready format to confidently showcase your financial projections to banks, franchise representatives, or investors. Impress stakeholders with clear, data-driven insights and professional reports.

Leverage the investor-ready format to confidently present your projections to banks, franchise representatives, or investors.