
All-in-one Dashboard
Core inputs and core outputs


This franchise business plan template provides a plug-and-play Excel framework for forecasting revenue, managing operational expenses, and calculating the total ROI for a single-unit operation.
Core inputs and core outputs
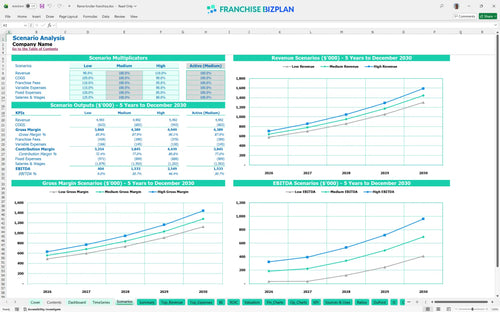
Three scenario analysis
Presentation ready
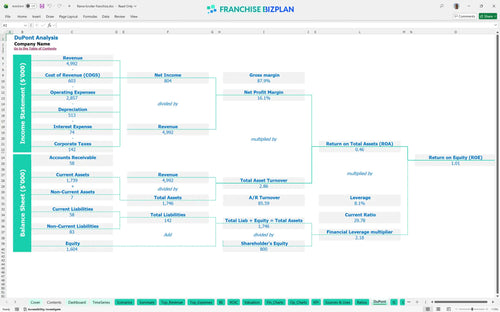
DuPont analysis
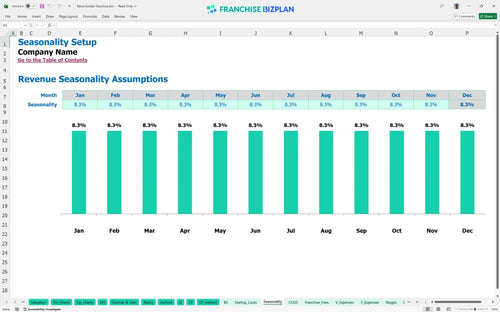
Researched revenue assumptions
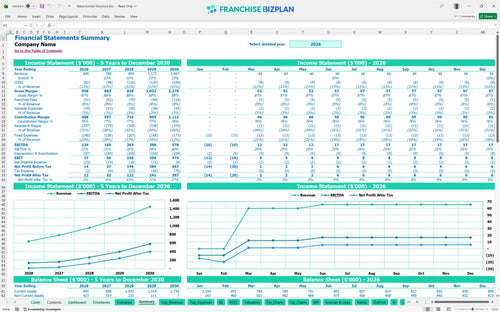
Lender-friendly financial outputs
Revenue stream detailed view
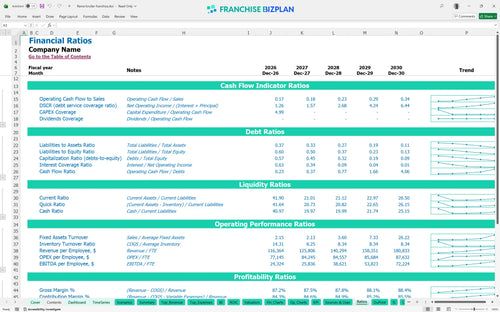
Performance metrics benchmark
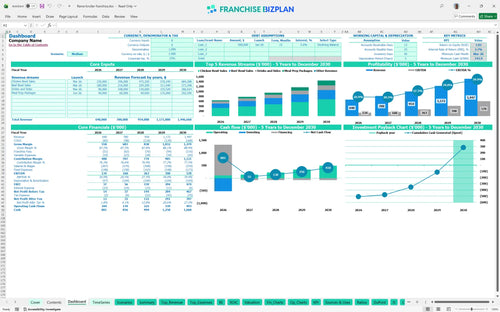
We built this franchise unit financial model using our own research to help you evaluate the unit economics of this healthy-eating concept. Key assumptions, including the $65,000 manager salary and the 8% total royalty and marketing burden, are pre-populated and fully editable. This tool shows how a $640,000 first-year revenue can scale into a $578,000 EBITDA by year five. Every cell is open for your input.
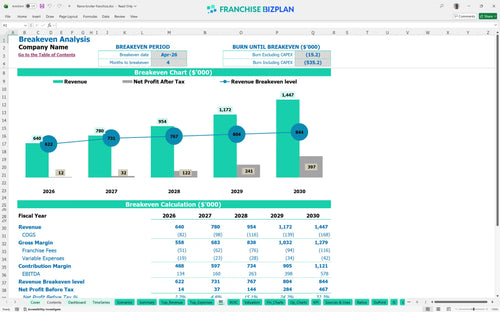
This franchise unit becomes profitable in April 2026, just four months after you start trading. By keeping food ingredients at roughly 11% and managing your $117,000 management payroll, you can transition from a $134,000 year-one EBITDA to a much stronger position as the location matures. Speed to profit is the only metric that keeps the lights on.
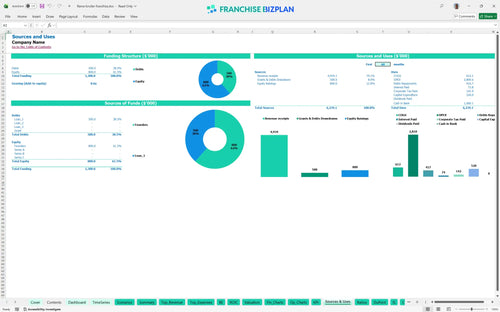
Launching this unit requires a total capital expenditure of $520,000 plus a working capital buffer. Your primary costs include $220,000 for leasehold improvements and $110,000 for specialized flame-grilling equipment, all funded through your initial sources to ensure the doors open by March 2026. Capital is your fuel; don't run out before the first turn.
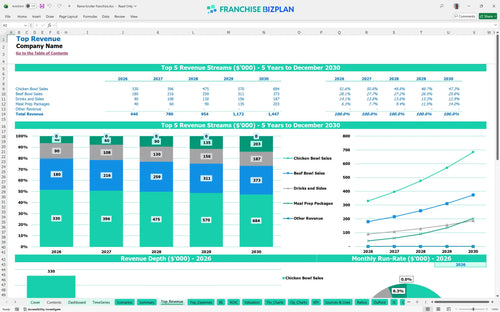
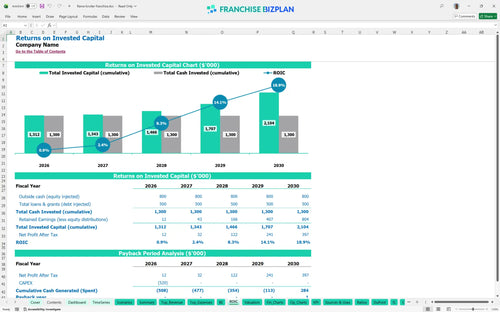
Investors can expect an Internal Rate of Return of 2.66% and a 5-year payback period based on the current growth trajectory. While the initial ROI calculation shows a 1.01 return on equity, the real value lies in the scaling revenue, which hits $1.447 million by 2030. Patience is a requirement for this five-year play.
The unit reaches its break-even point in April 2026, once monthly revenue covers your $8,500 rent and fixed operating expenses. The primary driver for this is throughput, specifically balancing your $52,000 assistant manager cost against peak lunch hour traffic. Break-even is the first real victory in franchising.
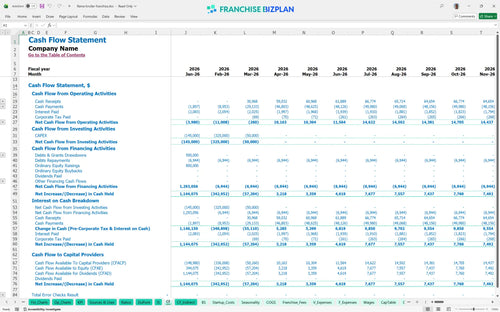
Your lowest cash point is $744,000 in March 2026, meaning you need a significant runway before the unit turns cash-flow positive. It is defintely important to maintain a buffer to cover the $1,600 monthly utilities and $900 marketing spend during the first few months of operation. The lowest cash point is where most owners lose sleep.
Comparing scenarios shows that a high-performing unit can reach the $1.447 million revenue target faster, significantly improving year-one margins. If sales lag in a low scenario, the five-year payback period could stretch, making local marketing execution and crew productivity your most important levers. Planning for the worst helps you reach the best.
Finance: update unit break-even and payback model by Friday
This franchise unit financial model is fully customizable in Excel, with pre-filled formulas and editable assumptions that make it easy to adapt to your specific territory. You can tweak everything from local labor rates to rent costs, ensuring the model reflects your actual market conditions rather than just a corporate average. Every cell is open for your input, so you can build a scenario that actually makes sense for your bank account.

Mapping out five years of performance is the only way to see how scaling affects your bottom line in a fast-casual environment. This model tracks revenue, costs, and cash flow from your 2026 launch through 2030, showing how a $640,000 year-one top line can grow to over $1.4 million by year five. Growth isn't a guess when you have a five-year map to follow.

Understanding the real cost of brand support is vital for protecting your store-level margin. This tool captures the $35,000 initial fee plus the ongoing 5% royalty and 3% marketing fund contributions, so you know exactly how much goes to the franchisor before you pay your own bills. Royalties are a permanent tax on your top line, and this model treats them with the precision they deserve.

Launching a new location requires a clear view of your total investment and the sales needed to stay afloat. This model breaks down everything from the $220,000 leasehold improvements to the $110,000 grilling equipment, helping you estimate the exact revenue target required to cover your $8,500 monthly rent. Knowing your number makes the first year much less scary.

Don't fly blind when setting your budget for a new territory. The model includes built-in benchmarks for labor and food costs, defintely helping you spot if your 11% ingredient cost assumption is too aggressive or right on the money. It is a vital sanity check that keeps your ego from overinflating your profit expectations. Benchmarks keep your ego in check.


Simply purchase and download the financial model template, then access it instantly using Microsoft Excel or Google Sheets. No installation or technical expertise required-just open and start working.

Enter your business-specific numbers, including revenue projections, costs, and investment details. The pre-built formulas will automatically calculate financial insights, saving you time and effort.

Leverage the investor-ready format to confidently showcase your financial projections to banks, franchise representatives, or investors. Impress stakeholders with clear, data-driven insights and professional reports.

Leverage the investor-ready format to confidently present your projections to banks, franchise representatives, or investors.