
All-in-one Dashboard
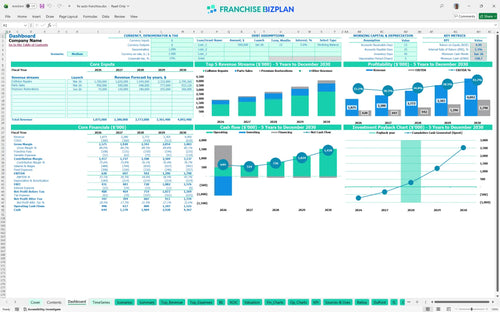
Core inputs and core outputs


This financial model template for collision repair business includes everything from CAPEX scheduling to multi-year P&L forecasting in one integrated Excel file.
Core inputs and core outputs
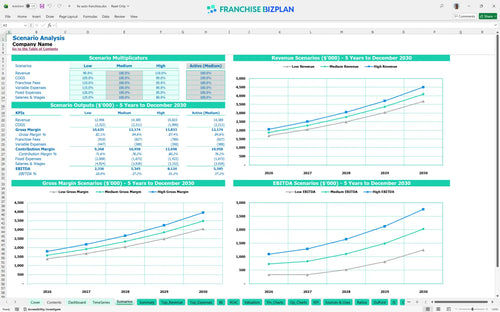
Three scenario analysis
Presentation ready
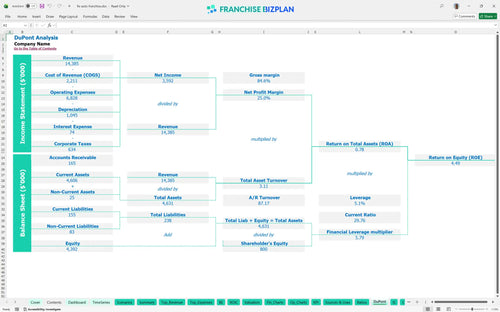
DuPont analysis
Researched revenue assumptions
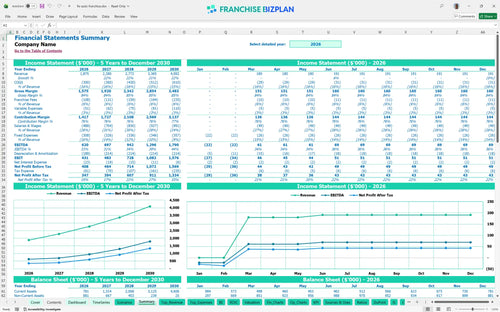
Lender-friendly financial outputs
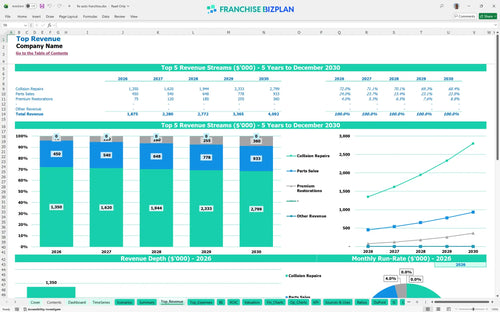
Revenue stream detailed view
Performance metrics benchmark
We built this collision repair franchise financial model using detailed market research to ensure your projections are grounded in operational reality. The model comes pre-populated with researched data, including a $1.875M Year 1 revenue target and a $620,000 EBITDA forecast, and it is defintely fully editable to match your specific site. Data drives decisions, not guesses.
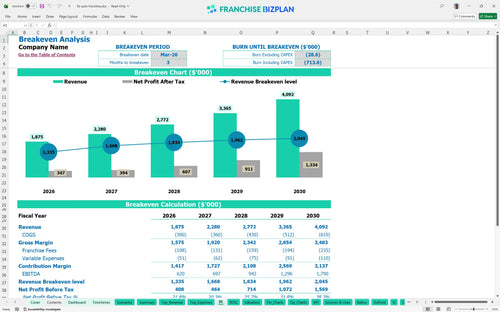
The unit is projected to reach break-even in March 2026, just three months after launching. This rapid trajectory assumes you hit your $900,000 initial collision repair target while managing a 5% royalty and 12% parts cost. Speed to profit is your best defense.
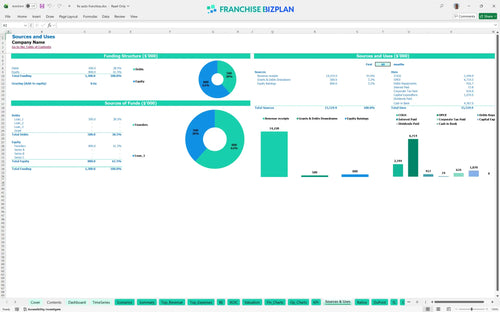
You will need approximately $1,070,000 to launch, covering everything from the $10,000 franchise fee to $450,000 in leasehold improvements. This franchise investment breakdown ensures you account for the $200,000 paint booth and $150,000 in lifts and frame machines before opening your doors. Watch the build-out costs like a hawk.
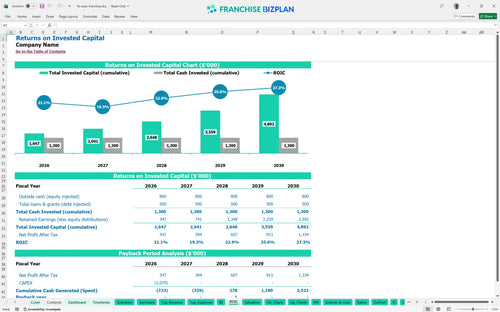
Investors can expect a 5.32% Internal Rate of Return (IRR) and a 4.49% Return on Equity (ROE) based on these projections. The payback period is estimated at 3 years, which is a solid automotive franchise financial feasibility study result for a high-CAPEX (capital expenditure) model. Time is money, and payback is the clock.
The monthly break-even point is reached in month 3, driven by the need to cover $18,000 in rent and $30,000+ in monthly technician wages. Operating expense forecasting shows that throughput and parts margins are the biggest levers for hitting this goal early. Volume solves many problems, but margin solves them all.
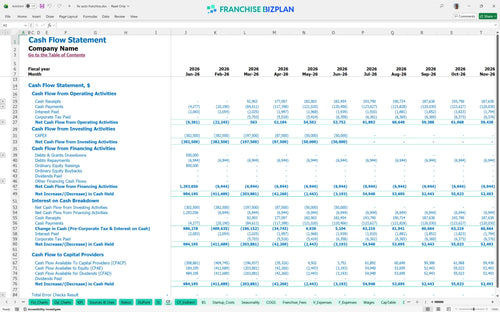
The lowest cash point is projected at $321,000 in June 2026, meaning you need a healthy buffer during the first six months of operation. This Excel spreadsheet for franchise cash flow forecasting helps you identify exactly when you might need to tighten the belt or delay a hire. Cash is oxygen for a new shop.
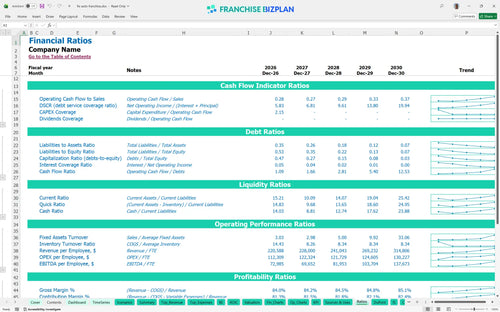
Estimating profitability for a new franchise location requires looking at Low, Medium, and High cases; a 10% drop in revenue can delay your 3-year payback significantly. This franchise unit performance evaluation template allows you to stress-test how Year 5 EBITDA of $1.79M holds up if labor costs spike. Plan for the worst, but execute for the best.
Finance: update unit break-even and payback model by Friday
This franchise business plan excel is a fully editable tool designed for the automotive sector. You can adjust every assumption from bay throughput to technician efficiency, making it the best financial planning tools for franchise owners who need to adapt to specific local market conditions. All formulas are pre-set to handle the heavy lifting of your collision repair franchise financial model.

Planning for the long term is vital in the automotive industry, where equipment cycles and lease terms span several years. This franchise financial projection template provides a detailed financial forecasting guide for new franchise owners, covering five years of revenue, EBITDA (earnings before interest, taxes, depreciation, and amortization), and cash flow. It ensures you see the full picture from the initial ramp-up to a mature, high-volume operation.

Understanding franchise royalty and marketing fees is critical for protecting your store-level margins. The model includes specific inputs for the franchise royalty fee structure, typically 5%, and marketing fund contributions of 0.75%. This transparency helps you calculate exactly how much of your $1.87M first-year revenue stays in your pocket after corporate obligations are met.

Knowing how to calculate startup costs for an auto repair franchise prevents mid-project funding gaps. This model breaks down the $1.07M total investment, including leasehold improvements and specialized equipment like paint booths. It maps out the path to your March 2026 break-even point, showing exactly when your monthly sales will cover the $18,000 rent and other fixed overheads.

We integrated automotive industry financial benchmarks to help you sanity-check your projections against real-world standards. Whether you are looking at paint and supply costs at 4% of sales or labor ratios for certified technicians, these benchmarks ensure your auto repair franchise profitability analysis is grounded in reality. It is a vital tool for verifying if your $85,000 manager salary fits the unit economics.


Simply purchase and download the financial model template, then access it instantly using Microsoft Excel or Google Sheets. No installation or technical expertise required-just open and start working.

Enter your business-specific numbers, including revenue projections, costs, and investment details. The pre-built formulas will automatically calculate financial insights, saving you time and effort.

Leverage the investor-ready format to confidently showcase your financial projections to banks, franchise representatives, or investors. Impress stakeholders with clear, data-driven insights and professional reports.

Leverage the investor-ready format to confidently present your projections to banks, franchise representatives, or investors.