
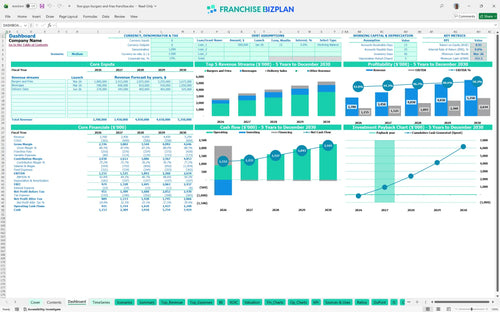
All-in-one Dashboard
Core inputs and core outputs


This restaurant franchise financial projection template excel includes a complete pro forma suite, CAPEX schedules, and scenario analysis tools designed specifically for high-volume burger operations.
Core inputs and core outputs
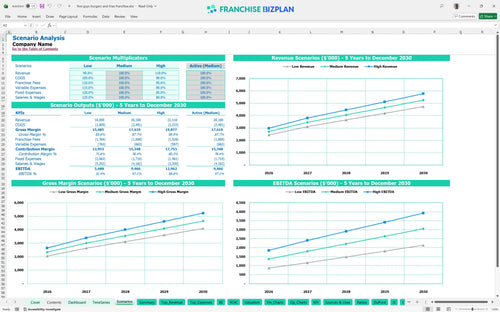
Three scenario analysis
Presentation ready
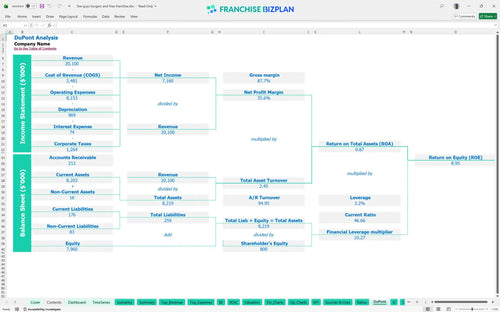
DuPont analysis
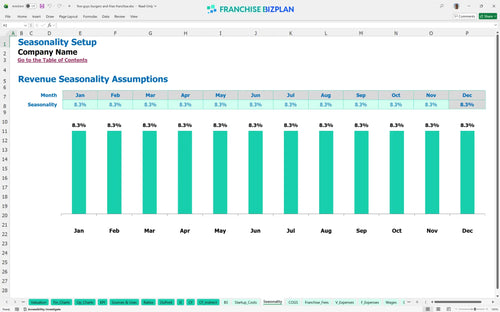
Researched revenue assumptions
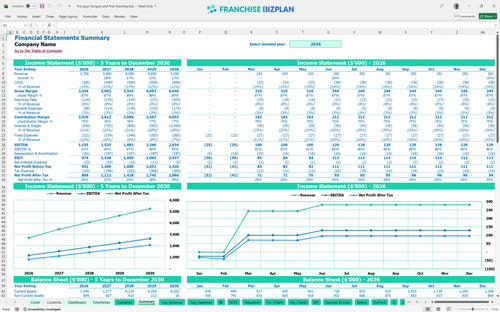
Lender-friendly financial outputs
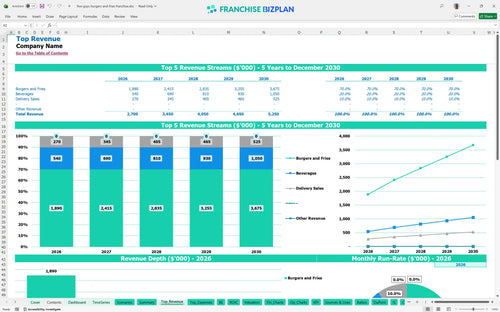
Revenue stream detailed view
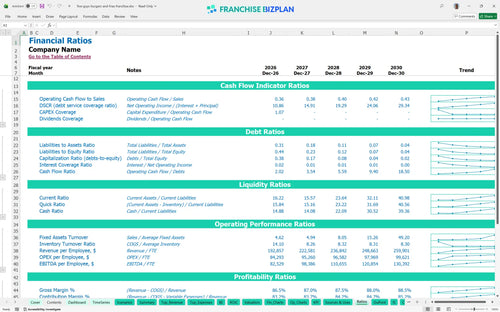
Performance metrics benchmark
We built this franchise unit financial model using our own research to provide a realistic view of a high-volume burger operation. Key assumptions, such as the $2.7M Year 1 revenue and the $1,155,000 EBITDA, are pre-populated with researched data and remain fully editable. This tool allows you to conduct a detailed franchise unit profitability analysis by adjusting labor, rent, and COGS to match your specific market conditions.
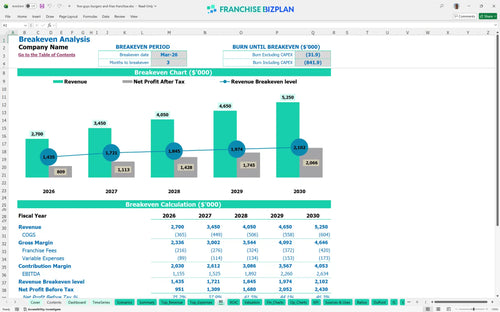
The unit is projected to reach profitability quickly, with a breakeven date of March 2026. By Year 5, forecasting revenue for a new burger franchise shows a climb to $5,250,000, supported by a 10% food cost and efficient labor management. Profitability is defintely tied to maintaining high throughput and managing the 8% total fee load effectively.
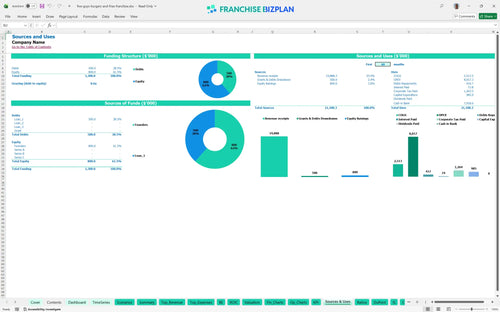
To launch this unit, your restaurant franchise startup budget template needs to account for $985,000 in total initial investment. This covers the $25,000 franchise fee, $500,000 for leasehold improvements, and $360,000 for kitchen equipment and signage. You also need to cover the initial franchise fee before you even break ground on a prime site.
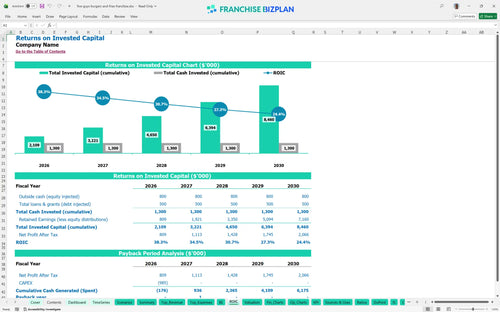
Calculating ROI for fast food franchise investment reveals a 9.83% IRR and a 2-year payback period. With a Return on Equity of 8.95%, the model demonstrates that the high-volume sales of this burger restaurant business model spreadsheet can rapidly recover the initial startup costs. These figures rely on hitting the $2.7M Year 1 revenue target through strong local execution.
The unit hits its monthly break-even point in March 2026, just three months after the January launch. The biggest lever for reaching this point faster is managing the $20,000 monthly rent against the $1,260,000 in Year 1 burger and fry sales. Using a restaurant franchise startup budget template helps you monitor how labor costs for front crew and cooks impact this milestone.
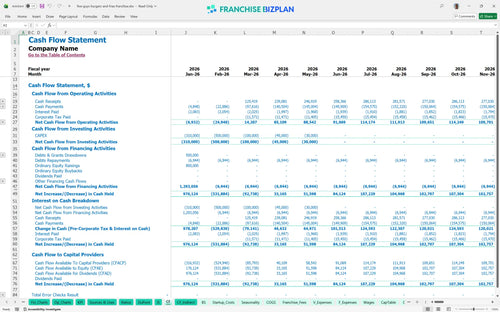
The lowest cash point is $352,000, occurring in March 2026 during the final stages of the initial ramp-up. This indicates you need a robust food service startup budget to bridge the gap between heavy CAPEX and positive cash flow. We recommend a conservative approach to hiring until the $180,000 in delivery sales starts flowing in June.
A fast casual franchise unit profit and loss statement shows significant variance between Low and High cases. In the High scenario, reaching $5.25M in Year 5 revenue maximizes the franchise royalty fee structure efficiency, while a Low scenario with high QSR operating expenses could strain the $352,000 cash floor. Accurate forecasting revenue for a new burger franchise is the key to managing these risks.
Finance: update unit break-even and payback model by Friday
This franchise financial model template is fully customizable in Excel, allowing you to adjust every assumption to fit your specific territory. With pre-filled formulas and editable inputs, you can easily modify labor rates, rent, or local supply costs to see how they impact your store-level EBITDA in real-time.

Long-term planning is essential for any restaurant franchise business plan to ensure sustainable growth. This model provides detailed 5-year projections for revenue, expenses, and cash flow, helping you map out the transition from a single-unit launch to a mature, profitable operation or multi-unit expansion.

Estimating franchise royalty and marketing fees accurately is vital because these costs are calculated on gross sales, not net profit. The model tracks the 6% royalty and 2% brand fund contributions against your projected revenue, ensuring you understand the real economics of your store-level margin after corporate obligations.

Knowing how to calculate burger franchise startup costs prevents capital shortfalls during the critical build-out phase. We break down the $985,000 initial investment, including leasehold improvements and equipment, to determine the exact monthly sales volume required to cover your fixed and variable operating costs.

The model incorporates built-in benchmarks for the fast casual restaurant financial model sector to help you sanity-check your numbers. You can compare your projected labor costs and occupancy expenses against industry standards to identify potential margin leaks and optimize your unit performance before opening day.


Simply purchase and download the financial model template, then access it instantly using Microsoft Excel or Google Sheets. No installation or technical expertise required-just open and start working.

Enter your business-specific numbers, including revenue projections, costs, and investment details. The pre-built formulas will automatically calculate financial insights, saving you time and effort.

Leverage the investor-ready format to confidently showcase your financial projections to banks, franchise representatives, or investors. Impress stakeholders with clear, data-driven insights and professional reports.

Leverage the investor-ready format to confidently present your projections to banks, franchise representatives, or investors.