
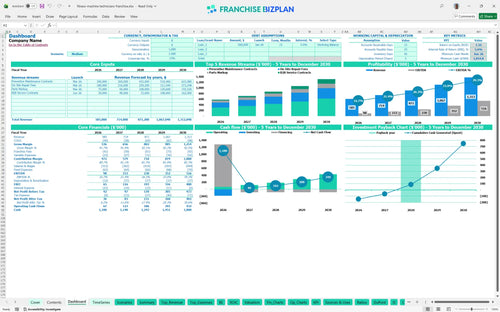
All-in-one Dashboard
Core inputs and core outputs


This comprehensive toolkit includes a dynamic dashboard, 5-year pro forma statements, a detailed CAPEX schedule, and a sensitivity analysis tool for multi-unit planning.
Core inputs and core outputs
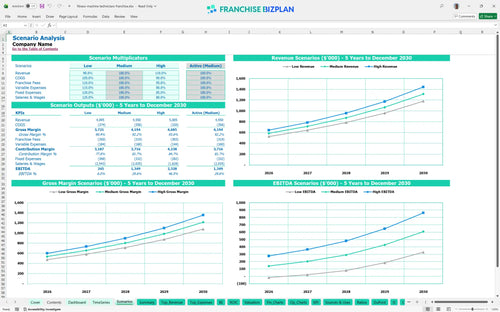
Three scenario analysis
Presentation ready
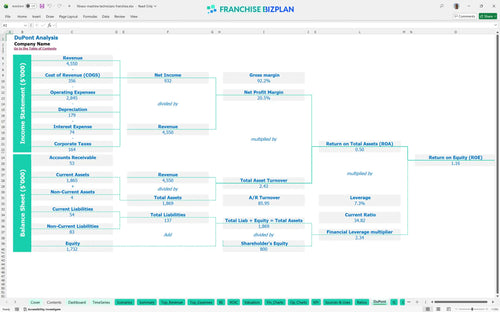
DuPont analysis
Researched revenue assumptions
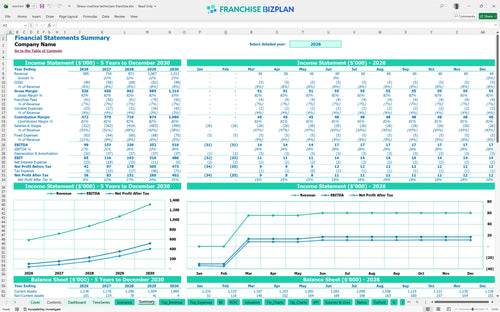
Lender-friendly financial outputs
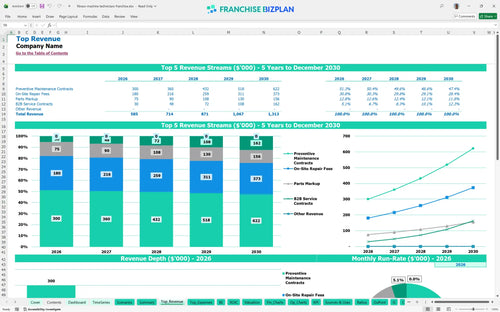
Revenue stream detailed view
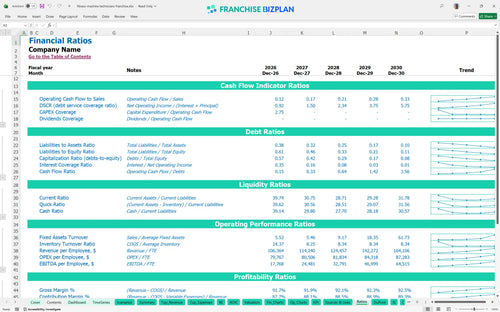
Performance metrics benchmark
We built this franchise unit financial model using our own research into the fitness equipment repair sector. Key assumptions like the $585,000 year-one revenue and the 6% royalty fee are pre-populated and fully editable to fit your specific territory. You defintely need a tool that handles the specific nuances of mobile service fleets and recurring B2B contracts.
The unit hits a positive EBITDA of $98,000 in its first year and scales to $516,000 by year five. This growth assumes you successfully transition from simple repair fees to high-margin preventive maintenance contracts. Net profit is calculated after accounting for the 6% royalty and 1% marketing fund. Profitability analysis for equipment repair businesses shows that scale comes from technician density.
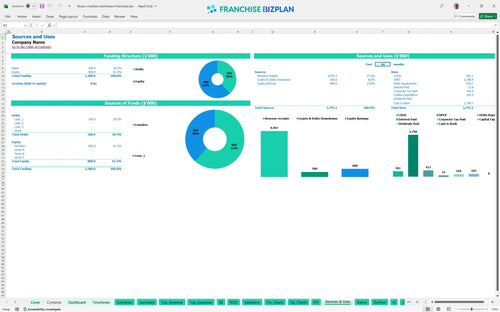
You need about $183,000 in upfront capital to cover the franchise fee, mobile vans, and diagnostic tools. This franchise startup cost calculator also accounts for a significant cash buffer, as the lowest cash point hits $1,055,000 in mid-2026. Most of your capital expenditure analysis focuses on the fleet and initial equipment. Having a strong cash cushion is vital for the first 12 months.
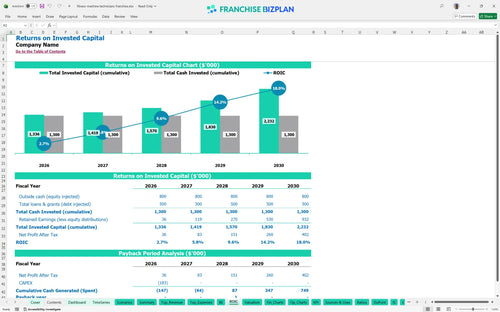
Investors can expect a 5.65% IRR and a return on equity of 1.16 over the five-year period. The payback period is 3 years, which is standard for a service-based business with low fixed overhead. This ROI calculator for gym equipment maintenance services shows your initial investment is recovered as you scale the B2B contract side of the house. Steady growth beats high-risk volatility every time.
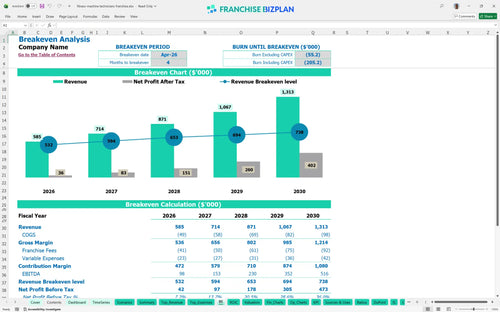
The model shows a break-even date of April 2026, just four months after launching. This quick turn happens because fixed costs like the $3,200 monthly rent are relatively low compared to the $585,000 in year-one revenue. This break-even analysis tool identifies technician productivity and route density as your biggest levers. Keeping your vans on the road and out of traffic is the goal.
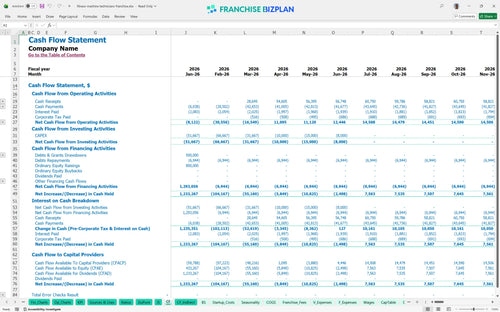
The lowest cash point occurs in June 2026 at $1,055,000, suggesting the model includes a very healthy starting capital position. You have plenty of runway, but managing fuel and travel costs is key to keeping that buffer intact. This operational expense budgeting tool helps you monitor the 2.8% fuel cost as you expand. If hiring technicians takes longer than expected, your wage expense drops but so does your capacity.
Our franchise unit financial analysis spreadsheet compares low, medium, and high cases to show how a 10% dip in revenue can delay your 3-year payback. The high case relies on hitting the $1.31 million revenue mark by year five through aggressive B2B contract acquisition. Moving from a single lead tech to a team of four by year five is the main driver of scale. Prepare for the worst but plan for the best.
This franchise financial model template is built in Excel, allowing you to tweak every variable from technician wages to fuel costs. You can easily adjust the pre-filled formulas to match your specific territory's density and local labor rates. This Excel financial model for fitness equipment maintenance business ensures you aren't flying blind when you sign your lease. It's a tool designed for builders, not just bookkeepers.

Map out your growth from a single van to a full fleet with detailed service franchise financial projectons. This model tracks revenue scaling from $585,000 in year one up to $1.31 million by year five. Use this financial forecasting template for new franchise owners to see how adding technicians impacts your bottom line over time. Planning five years out helps you spot the moment when you need to upgrade your headquarters fitout. Long-term clarity is the best hedge against market shifts.

Managing the math on a 6% royalty and a 1% marketing fund is crucial for protecting your store-level margin. This tool automates those calculations so you can see exactly how much cash stays in your pocket after brand obligations. Estimating recurring revenue for maintenance service contracts becomes easier when you know your fixed fees are already covered in the sheet. It's about knowing your real take-home pay after the franchisor gets their cut. Don't let royalties surprise your cash flow.

Starting a mobile service business requires a clear view of your initial burn before the first repair call. This fitness franchise business plan component helps you learn how to calculate startup costs for a mobile service franchise without missing the small stuff like uniforms or software. You'll see the exact sales volume needed to cover your $5,210 in monthly fixed overhead and technician salaries. Knowing your floor helps you sleep better at night. Speed to break-even is the most important metric in year one.

We've baked in industry-standard data to help you sanity-check your franchise unit economics model against real-world performance. This financial planning guide for service-based franchises compares your fuel, travel, and parts costs to typical repair industry averages. If your labor costs exceed the benchmark, the model flags it so you can adjust your staffing plan. Benchmarks keep your projections grounded in reality rather than optimism. Use the data to validate your gut feelings.


Simply purchase and download the financial model template, then access it instantly using Microsoft Excel or Google Sheets. No installation or technical expertise required-just open and start working.

Enter your business-specific numbers, including revenue projections, costs, and investment details. The pre-built formulas will automatically calculate financial insights, saving you time and effort.

Leverage the investor-ready format to confidently showcase your financial projections to banks, franchise representatives, or investors. Impress stakeholders with clear, data-driven insights and professional reports.

Leverage the investor-ready format to confidently present your projections to banks, franchise representatives, or investors.