
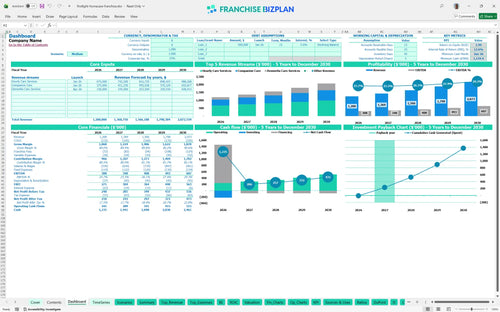
All-in-one Dashboard
Core inputs and core outputs


This template provides a complete roadmap for managing a non-medical home care revenue unit, from initial CAPEX to five-year cash flow. A solid plan is your best defense against surprises.
Core inputs and core outputs
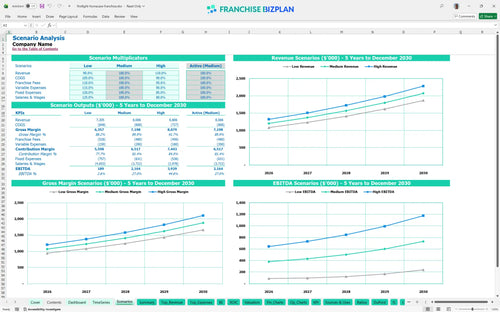
Three scenario analysis
Presentation ready
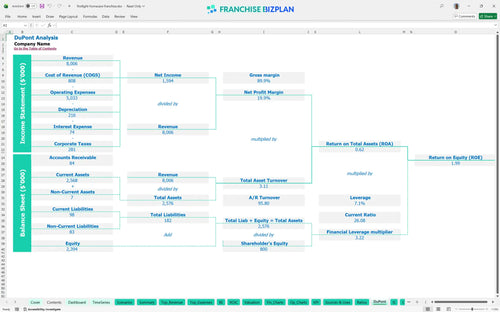
DuPont analysis
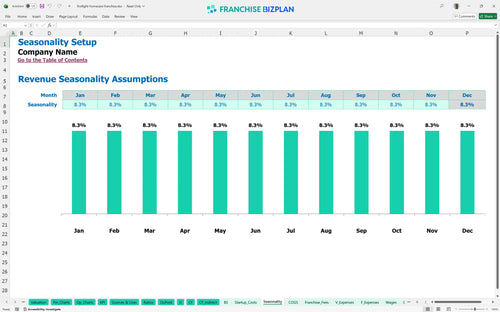
Researched revenue assumptions
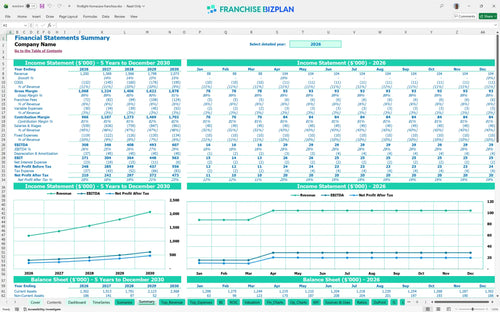
Lender-friendly financial outputs
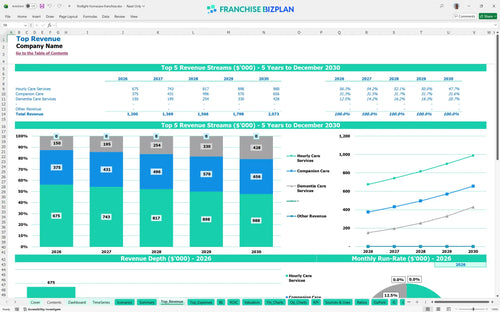
Revenue stream detailed view
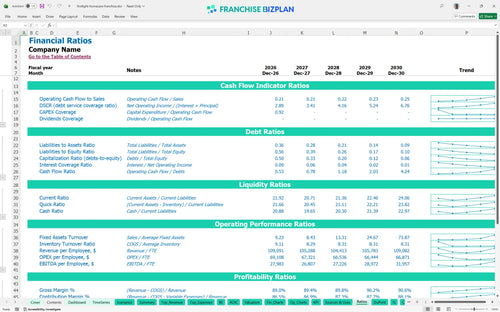
Performance metrics benchmark
We built this home care franchise financial model using detailed market research on non-medical care units. Key assumptions like the $4,500 monthly rent and the scaling caregiver team are pre-populated but fully editable to fit your market. With a projected Year 1 EBITDA (Earnings Before Interest, Taxes, Depreciation, and Amortization) of $308,000, this model helps you track the path from launch to a mature, high-volume operation.
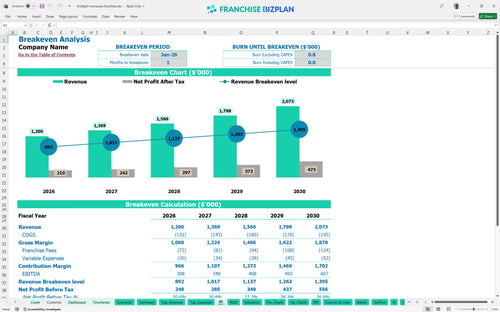
This unit hits its stride almost immediately, with a projected breakeven in January 2026. By accounting for the 6% total franchise fees and scaling caregiver wages, the model shows a steady climb in EBITDA from $308,000 to $607,000 over five years. It defintely helps to see how the dementia care launch in April 2026 boosts the top line while analyzing profitability of a home care franchise location. Profit follows precision in this business.
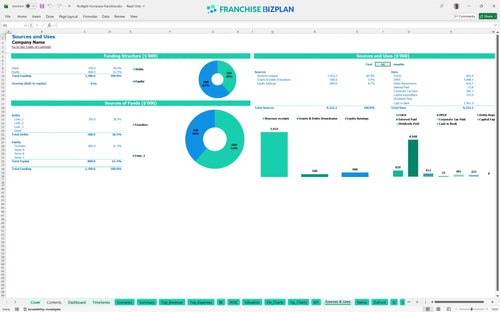
You will need roughly $223,000 in initial capital to cover the core startup costs. This includes the $50,000 franchise fee and $40,000 for staff vehicles to get your team mobile as part of your startup budget template for senior home care business. Here's the quick math: your biggest upfront hits are the office build-out and the initial franchise entry price. Cash is the fuel that keeps your doors open.
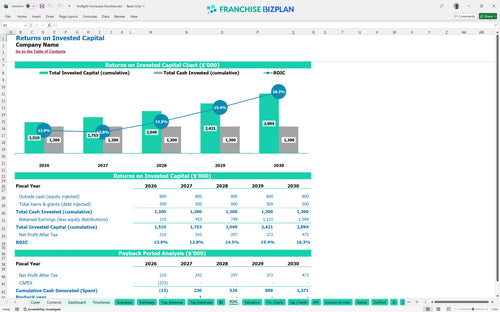
Investors can look forward to a 12.59% IRR (Internal Rate of Return) and a 2-year payback period. With a Return on Equity of 1.99, the model suggests a solid franchise unit economic performance for a service-based business. Still, calculating ROI for non-medical home care franchises depends heavily on how fast you can recruit and retain those 16 caregivers by year five. Returns look good, but execution is everything.
The model projects a break-even date in the very first month, January 2026. This assumes you hit the ground running with $450,000 in hourly care revenue right away. The biggest lever here is your caregiver utilization-if your staff is sitting idle, that break-even point will slip fast. Financial modeling for premium home care services requires tight control over fixed costs like the $4,500 rent. Speed to break-even is the ultimate survival metric.
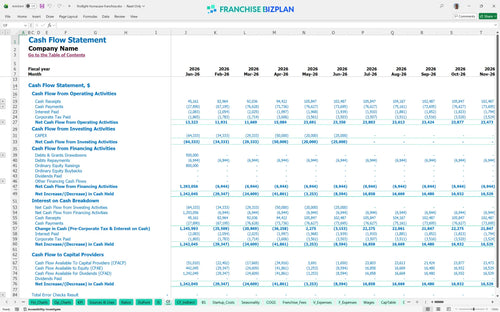
Your lowest cash point is projected at $1,134,000 in June 2026. This suggests you need a significant cash buffer to handle the initial CAPEX (Capital Expenditure) and franchise operational expenses. What this estimate hides is the timing of insurance payments and the $15,000 launch marketing spend. Franchise unit cash flow forecasting for healthcare is vital during this ramp-up. Watch your cash like a hawk during the ramp-up.
Comparing scenarios shows how a 10% drop in hourly care demand can delay your payback period significantly. In the high-growth case, hitting $2M in revenue by year five pushes your EBITDA margin toward 30% on your home care franchise unit economic forecast spreadsheet. The model helps you see how sensitive your cash flow is to caregiver recruitment costs and local marketing success. Scenarios prepare you for the real world.
Finance: update unit break-even and payback model by Friday.
This Excel financial template for home care franchise owners lets you swap out assumptions for your specific territory. Whether you are adjusting caregiver wages or local rent, the pre-filled formulas handle the heavy lifting. It is built so you can test different hiring speeds and see how they impact your bottom line. Your model should be as flexible as your caregivers.

We mapped out a five-year horizon to show how scaling from 8 to 16 caregivers changes your unit economics. You can track how revenue grows from $1.2M in year one to over $2M by year five when estimating revenue for a new senior care franchise unit. This long-term view is essential for spotting when you need to add more office support. Long-term planning beats short-term guessing every time.

The model accounts for the 5% royalty and 1% marketing fee right off the top. Honestly, these fees are a major part of your overhead, so we made sure they scale automatically with your sales. It helps you see exactly what stays in your pocket after the franchisor gets their cut. Royalties are the price of entry for a proven system.

Starting a senior care business requires clear eyes on the upfront spend, like the $50,000 franchise fee and $60,000 in leasehold improvements. Our break-even analysis shows you how to calculate startup costs for a home care franchise and when your monthly billables cover your fixed costs. Knowing your number helps you sleep at night.

We included benchmarks for things like mileage reimbursement and caregiver supplies to keep your numbers grounded. If your labor costs drift too far from the 2026 targets, you will know it is time to look at your scheduling efficiency. This tool follows best practices for home care franchise financial planning to ensure your margins stay healthy. Don't reinvent the wheel when you can use a benchmark.


Simply purchase and download the financial model template, then access it instantly using Microsoft Excel or Google Sheets. No installation or technical expertise required-just open and start working.

Enter your business-specific numbers, including revenue projections, costs, and investment details. The pre-built formulas will automatically calculate financial insights, saving you time and effort.

Leverage the investor-ready format to confidently showcase your financial projections to banks, franchise representatives, or investors. Impress stakeholders with clear, data-driven insights and professional reports.

Leverage the investor-ready format to confidently present your projections to banks, franchise representatives, or investors.