
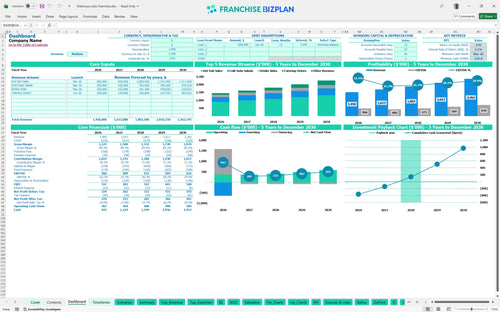
All-in-one Dashboard
Core inputs and core outputs


This financial model for new restaurant franchise location provides a ready-to-use Excel suite for projecting five years of P&L, cash flow, and ROI based on real-world sandwich shop economics.
Core inputs and core outputs
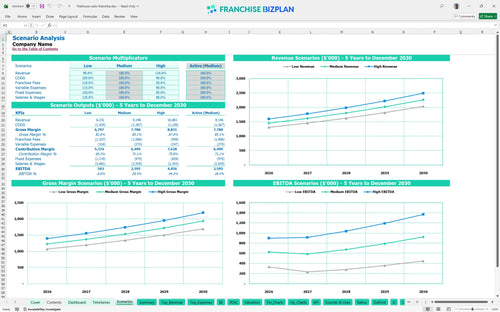
Three scenario analysis
Presentation ready
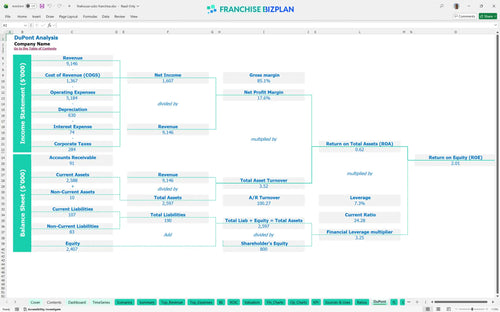
DuPont analysis
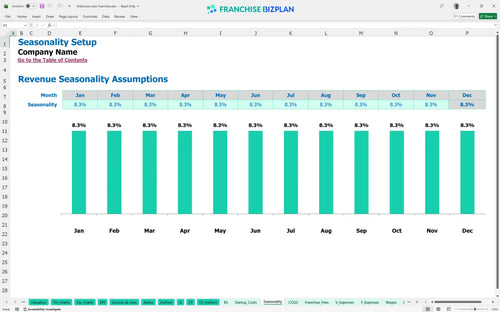
Researched revenue assumptions
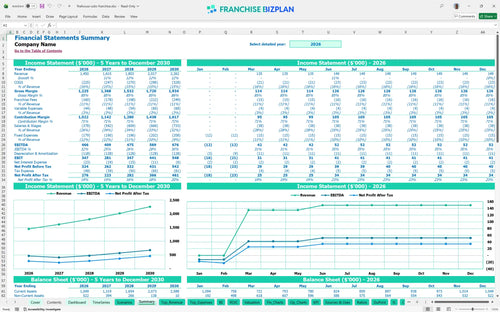
Lender-friendly financial outputs
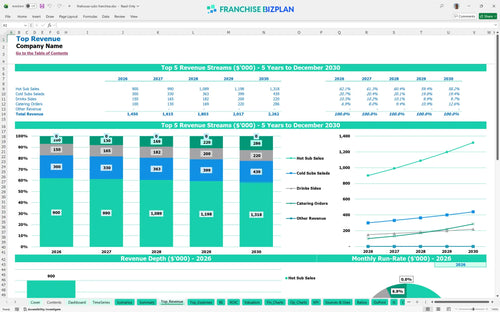
Revenue stream detailed view
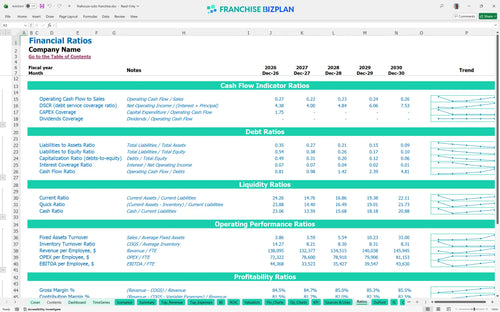
Performance metrics benchmark
We built this Firehouse Subs Franchise franchise unit financial model using our own research into the sandwich sector. Key assumptions like the $600,000 in hot sub sales and $10,000 monthly rent are pre-populated and fully editable. This model helps you see how the 6% royalty impacts your $1.45M year-one revenue target and your 3-year payback timeline.
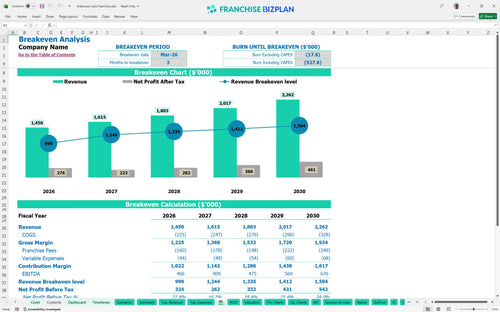
This unit hits its stride quickly, reaching break-even by March 2026, just three months after launch. With Year 1 EBITDA projected at $466,000, the model accounts for a 14% food cost and 11% total franchise fees to ensure your restaurant profitability analysis is grounded in reality.
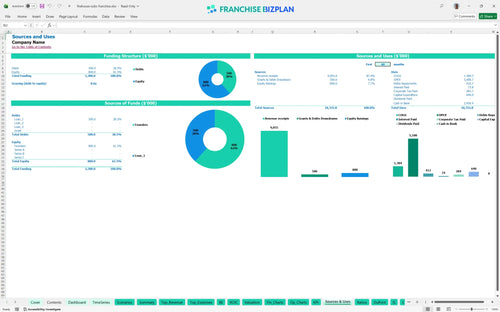
You will need approximately $640,000 to launch, covering the $350,000 build-out and $150,000 for steamers and slicers. This franchise investment ROI spreadsheet includes the $20,000 franchise fee and $25,000 for exterior signage, showing exactly how to calculate franchise startup costs in Excel.
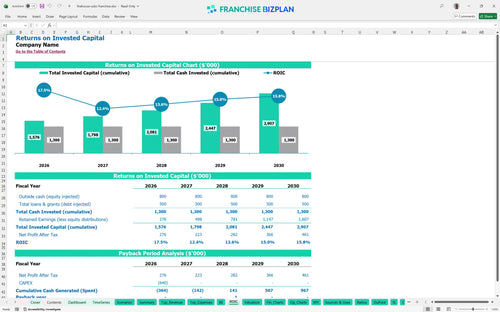
The model projects a 3-year payback period with an IRR of 5.08% and a return on equity of 2.01. While the initial years are capital-intensive, the steady climb in EBITDA from $466,000 to $676,000 by year five shows a strong long-term value play for any franchise unit.
Monthly break-even occurs in month 3, driven primarily by the $10,000 fixed rent and $120,000 annual manager and assistant manager salaries. To hit this, you must maintain throughput during the lunch rush to cover the 11% combined royalty and marketing burden while estimating labor costs for quick-service restaurants.
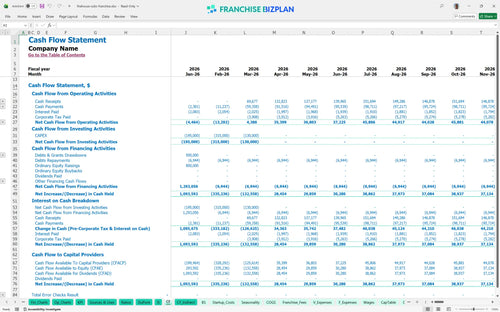
The lowest cash point is $626,000 in March 2026, coinciding with your break-even month. This franchise cash flow forecasting template for owners shows you need your full investment liquid at the start to cover the heavy $350,000 build-out costs before the first sub is sold.
A 10% drop in hot sub sales significantly delays your 3-year payback, while hitting the high case moves EBITDA toward the $676,000 mark faster. This sandwich shop franchise financial projections template allows you to toggle variables to see how Year 1 margins react to shifting labor costs or analyzing catering revenue for franchise units.
Finance: update unit break-even and payback model by Friday.
This franchise financial model template is built in Excel, allowing you to swap out every assumption from sandwich volume to local utility rates. You can adjust the 14% food cost or the $10,000 monthly rent to see how a different site impacts your bottom line. It is a flexible tool designed to help you stress-test your specific territory before signing a lease or committing capital.

Map your path from a $1.45M opening year to a $2.26M mature unit by year five. This restaurant franchise business plan includes detailed P&Ls that account for scaling your sandwich maker team from 5 to 7 full-time equivalents as volume grows. You will see exactly how the 5.08% IRR develops over a half-decade of operations, helping you evaluate franchise investment opportunities and risks with precision.

Managing a 6% royalty and a 5% marketing fee is non-negotiable for brand compliance. This model calculates these franchise royalty fees automatically against your projected $600,000 in annual hot sub sales. It ensures you never overlook the 11% off-the-top cost that funds national brand awareness and corporate support, which is vital for any franchise unit profit and loss statement example.

Use the franchise startup cost calculator to account for the $350,000 build-out and $150,000 in kitchen equipment. With a break-even date of March 2026, you need to know exactly how many subs must move to cover the $10,000 monthly rent. This break-even analysis identifies your margin of safety during the critical first 90 days of operation when cash flow is most volatile.

We defintely included benchmarks to sanity-check your $70,000 manager salary and 1.5% payment processing fees. Comparing your unit economics against best practices for restaurant franchise financial planning helps identify if your labor or food costs are drifting. It is the fastest way to spot a margin leak before it becomes a cash crisis in your QSR franchise operating budget spreadsheet.


Simply purchase and download the financial model template, then access it instantly using Microsoft Excel or Google Sheets. No installation or technical expertise required-just open and start working.

Enter your business-specific numbers, including revenue projections, costs, and investment details. The pre-built formulas will automatically calculate financial insights, saving you time and effort.

Leverage the investor-ready format to confidently showcase your financial projections to banks, franchise representatives, or investors. Impress stakeholders with clear, data-driven insights and professional reports.

Leverage the investor-ready format to confidently present your projections to banks, franchise representatives, or investors.