
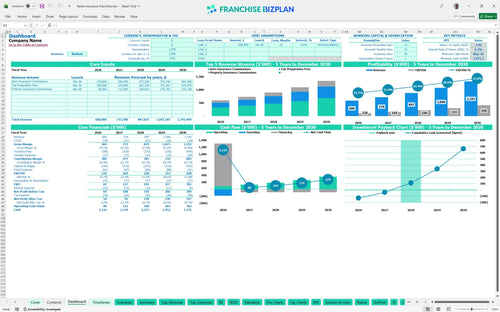
All-in-one Dashboard
Core inputs and core outputs


This Excel template for franchise unit financial forecasting provides a complete toolkit for analyzing the revenue potential and cash flow of a retail insurance and tax preparation agency. Data beats gut feeling every time.
Core inputs and core outputs
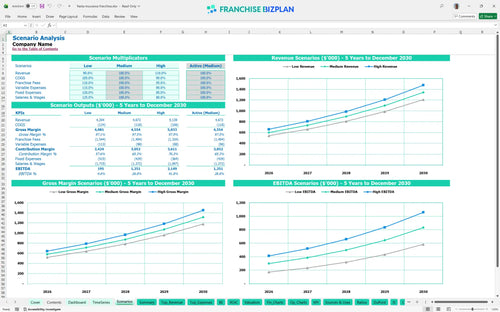
Three scenario analysis
Presentation ready
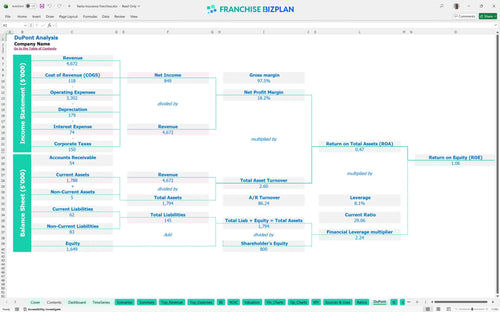
DuPont analysis
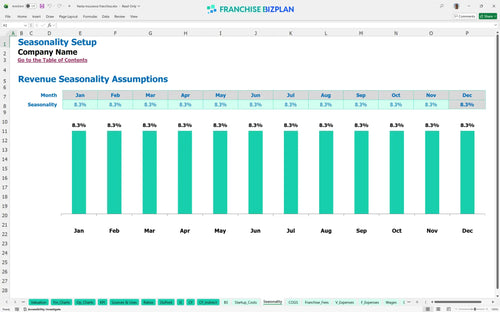
Researched revenue assumptions
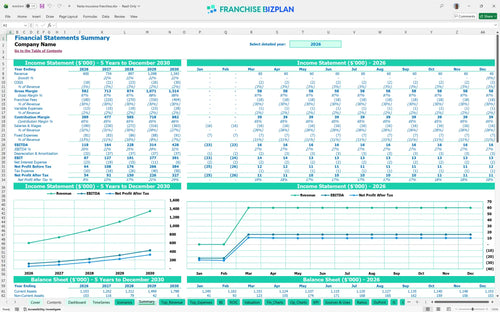
Lender-friendly financial outputs
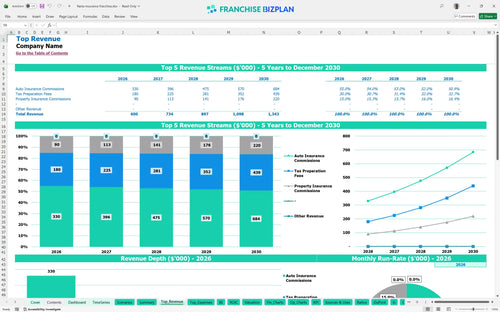
Revenue stream detailed view
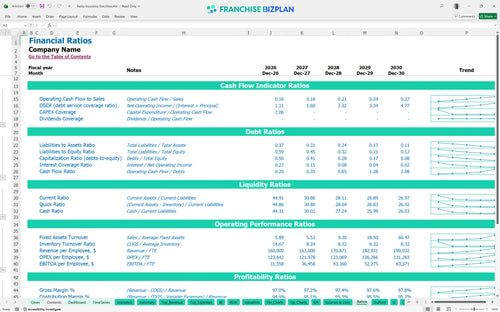
Performance metrics benchmark
We built this insurance and tax preparation franchise financial model using deep research into retail service units. The assumptions for revenue stream modeling, including auto insurance commissions and tax fees, plus expenses like the 25% royalty and $85,000 build-out, are pre-populated and ready for your specific location. With a year-one EBITDA of $118,000 already modeled, you can see how the dual-service approach generates immediate cash flow while you scale to a $428,000 EBITDA by year five.
The unit hits positive EBITDA in year one, generating $118,000 in earnings despite the high 25% royalty burden. Profitability scales as tax preparation fees grow from $120,000 to nearly $293,000 by year five, leveraging fixed costs like rent.
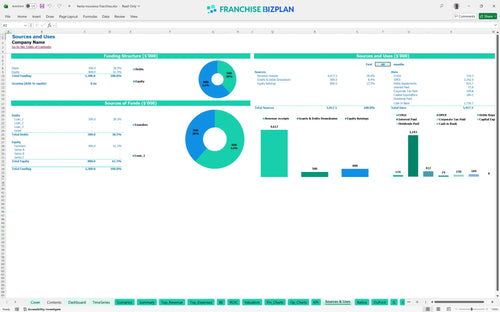
You need $184,250 to launch this retail franchise in the US, covering everything from the $25,000 franchise fee to the $85,000 leasehold improvements. This startup budget template for service-based franchise ensures you have the workstations and signage needed to attract foot traffic.
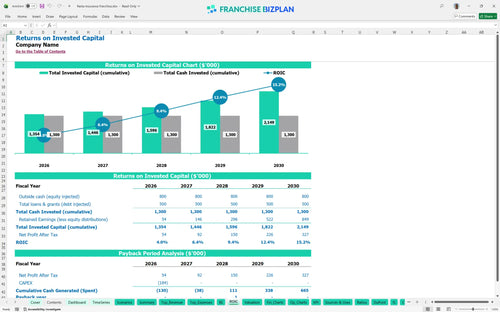
Investors can expect a 6.18% IRR and a 1.06 ROE, with a full payback achieved in 3 years. This franchise unit cash flow statement example shows that steady recurring commissions provide a stable foundation for long-term ROI calculation and multi-unit growth.
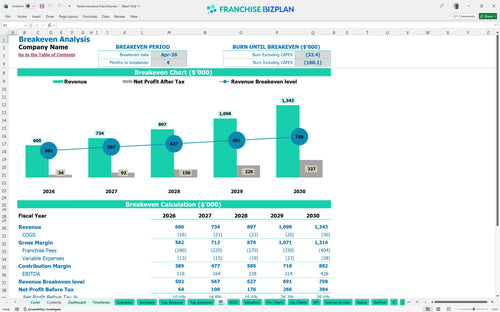
The unit reaches its monthly break-even point in April 2026, just 4 months after opening. Analyzing revenue potential for insurance agency franchise units shows this fast ramp-up is driven by immediate tax season demand and manageable $4,800 monthly rent.
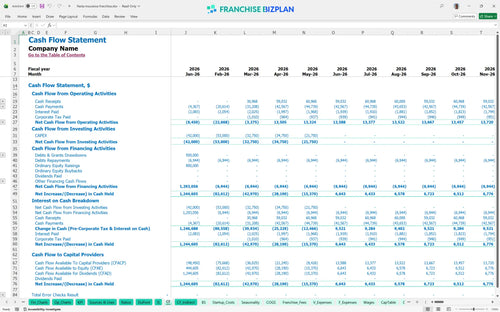
The lowest cash point occurs in May 2026 at $1,075,000, suggesting a very strong initial capitalization. This small business financial projection template helps you monitor the timing of large CAPEX payments like the $85,000 build-out to protect your liquidity.
Evaluating profitability of a retail insurance franchise requires looking at High vs. Low cases; a 10% drop in commissions can delay payback significantly. High-performance scenarios see year-one margins improve if tax prep volume exceeds the $120,000 forecast.
This franchise financial model template is built in Excel, allowing you to tweak every variable from commission splits to local rent. You can adjust the pre-filled formulas to match your specific territory, ensuring your insurance franchise business plan reflects local market density and actual labor costs. Every cell is open for your input.

Planning for the long haul is critical when learning how to build a 5-year financial projection for a new franchise. This model maps out your growth from a $600,000 year-one revenue base to $1.34M by year five, giving you a clear view of how scaling your licensed agent count impacts your bottom line. Growth is a math problem, not a guessing game.

The model handles the heavy lifting of estimating monthly royalties and operating expenses for franchises by automating the 25% royalty and 5.05% marketing fund calculations. This ensures you see exactly how much cash stays in the unit after the franchisor takes their cut of the auto and property insurance commissions. Royalties are the price of a proven system.

Using our franchise startup cost spreadsheet, you can track the $184,250 initial investment across leaseholds, equipment, and fees. It includes a detailed break-even analysis to show exactly when your monthly tax preparation fees and commissions cover your $4,800 retail plaza rent and payroll. Knowing your zero-point changes how you sleep at night.

We defintely included benchmarks to help with your franchise profitability analysis, comparing your results against standard retail insurance margins. The operating expense forecast uses real-world data for utilities, janitorial services, and bilingual staffing to ensure your projections aren't just guesswork. Don't build a model on hope alone.


Simply purchase and download the financial model template, then access it instantly using Microsoft Excel or Google Sheets. No installation or technical expertise required-just open and start working.

Enter your business-specific numbers, including revenue projections, costs, and investment details. The pre-built formulas will automatically calculate financial insights, saving you time and effort.

Leverage the investor-ready format to confidently showcase your financial projections to banks, franchise representatives, or investors. Impress stakeholders with clear, data-driven insights and professional reports.

Leverage the investor-ready format to confidently present your projections to banks, franchise representatives, or investors.