
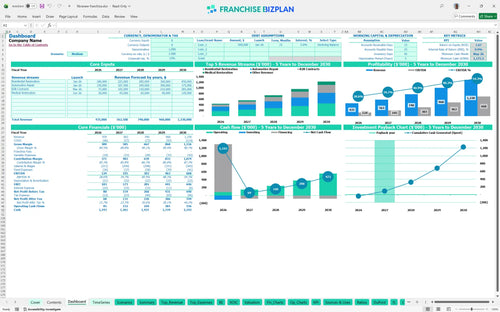
All-in-one Dashboard
Core inputs and core outputs


This franchise unit investment and cash flow analysis template provides a comprehensive Excel-based framework for projecting five-year performance, startup costs, and cash flow for a mobile restoration business.
Core inputs and core outputs
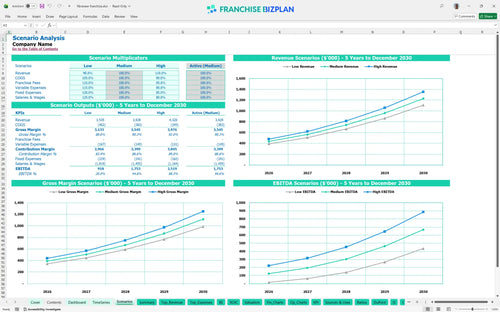
Three scenario analysis
Presentation ready
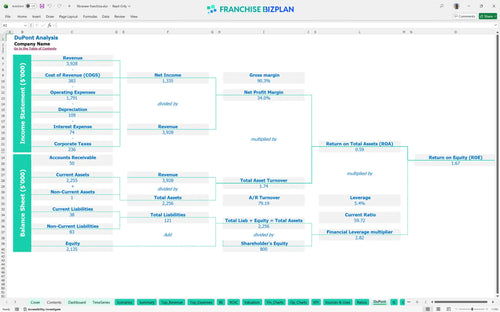
DuPont analysis
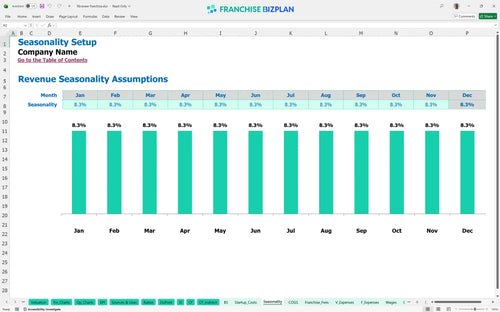
Researched revenue assumptions
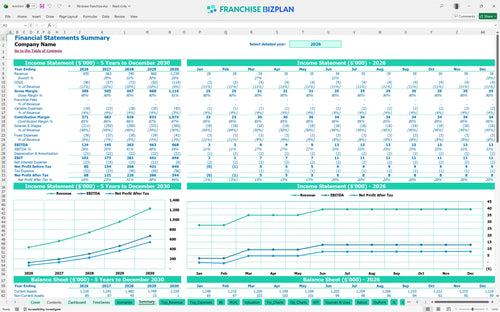
Lender-friendly financial outputs
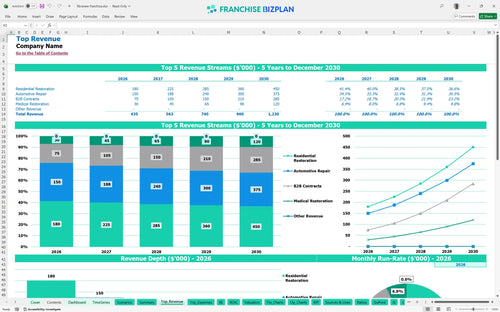
Revenue stream detailed view
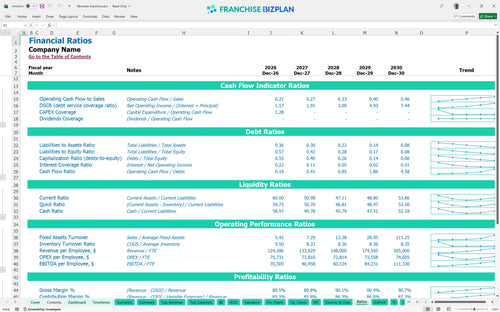
Performance metrics benchmark
We built this franchise unit financial model using our own research on the mobile restoration sector. Key assumptions like the $435,000 year-one revenue and the $109,500 initial capital outlay are pre-populated and fully editable. This tool helps you move from guessing to planning with hard numbers on EBITDA and cash flow.
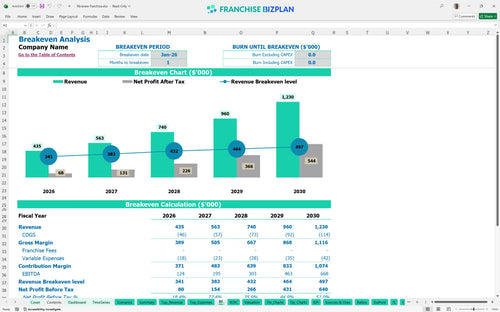
This franchise unit is designed for a fast start, reaching the break-even point in January 2026, just one month after launch. By the end of year one, you are looking at an EBITDA of $124,000, which scales significantly as you add technicians and B2B contracts. Estimating profit margins for mobile leather repair businesses is easier when you see the five-year revenue climb to $1.23 million. Speed to profit is the best hedge against risk.
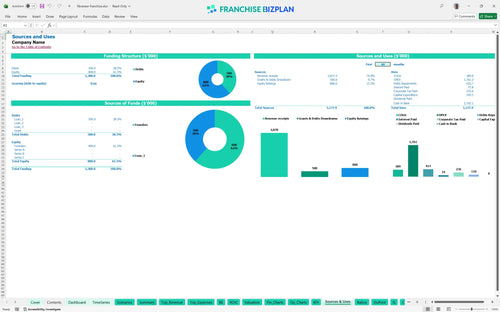
To get this mobile restoration franchise off the ground in the US, you will need approximately $109,500 in total startup capital. This investment covers the $47,000 franchise fee, a $35,000 service vehicle, and $12,000 for the essential restoration tools kit required to meet brand standards. Knowing how to calculate startup costs for a mobile restoration franchise ensures your capital expenditure planning is accurate from day one.
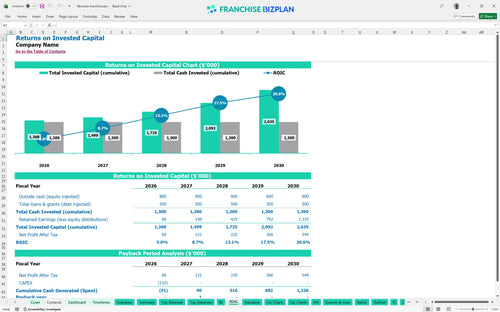
The financial model template for service-based franchise units projects a 9.87% internal rate of return (IRR) and a 2-year payback period. This is defintely a strong result for a mobile model, supported by a 1.67 return on equity (ROE) as the business matures toward $1.23 million in annual revenue. ROI analysis is built into every tab to help you track long-term value creation.
Your break-even point occurs in January 2026, requiring only minimal initial volume to cover the $3,000 in monthly fixed costs like vehicle leases and insurance. Financial planning for mobile automotive repair franchises depends heavily on technician productivity and job density. This break-even point calculator helps you determine exactly how many residential or B2B jobs you need each week to stay in the black.
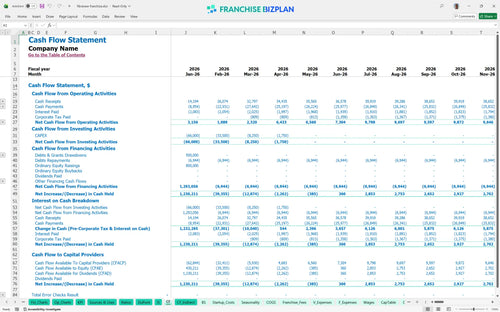
The model identifies May 2026 as the lowest cash point, with a projected minimum balance of $1,175,000. Cash is the oxygen of a mobile fleet. Analyzing recurring revenue in service franchise financial models helps you understand the runway needed to bridge the gap between job completion and B2B payment collection. Maintaining a healthy buffer ensures you can handle seasonal dips or equipment upgrades.
The franchise unit financial performance projection template includes Low, Medium, and High cases to test your assumptions. In the High scenario, revenue reaches $1.23 million by year five, while the Year 1 EBITDA margin starts strong at 28%. These scenarios show how sensitive your peak cash need is to changes in labor costs and local marketing execution. Planning for the high case is how you actually hit the medium case.
This franchise financial model template is fully customizable in Excel, allowing you to adjust pre-filled formulas and assumptions to match your specific territory and local market conditions. Whether you are planning a single mobile unit or a multi-territory expansion, the best excel template for franchise unit business planning makes it easy to adapt revenue drivers and cost structures. You can refine everything from technician pay scales to local marketing spend to see the immediate impact on your bottom line.

Plan for the long term with a business financial projections template that maps your journey from launch to a mature operation with $1.23 million in annual sales. The model provides a detailed look at how to build a financial forecast for a new franchise, covering five years of revenue growth, cash flow requirements, and balance sheet health. This allows you to visualize the transition from an owner-operator model to a multi-technician service fleet.

Understanding your financial obligations is critical, so the model tracks the $47,000 initial fee and ongoing franchise royalty fees to ensure you see the true net profit of your unit. While the current data shows a 0% royalty and marketing fund contribution, the template allows you to input any future adjustments to brand-level costs. This transparency helps you manage the real economics of the franchise relationship without surprises.

The franchise startup cost spreadsheet helps you estimate the total initial investment of $109,500 and identifies the exact sales volume needed to cover your $3,000 monthly fixed overhead. By analyzing the relationship between your average ticket and variable costs, you can pinpoint the moment your mobile unit moves into the black. This clarity is essential for managing working capital during the critical first few months of operation.

This franchise unit profitability analysis incorporates built-in benchmarks for labor, materials, and vehicle expenses to help you sanity-check your operating assumptions. Use the spreadsheet for tracking franchise operating expenses to compare your technician productivity and material waste against industry standards. These benchmarks act as a guardrail, ensuring your financial plan remains realistic and achievable in the competitive restoration market.


Simply purchase and download the financial model template, then access it instantly using Microsoft Excel or Google Sheets. No installation or technical expertise required-just open and start working.

Enter your business-specific numbers, including revenue projections, costs, and investment details. The pre-built formulas will automatically calculate financial insights, saving you time and effort.

Leverage the investor-ready format to confidently showcase your financial projections to banks, franchise representatives, or investors. Impress stakeholders with clear, data-driven insights and professional reports.

Leverage the investor-ready format to confidently present your projections to banks, franchise representatives, or investors.