
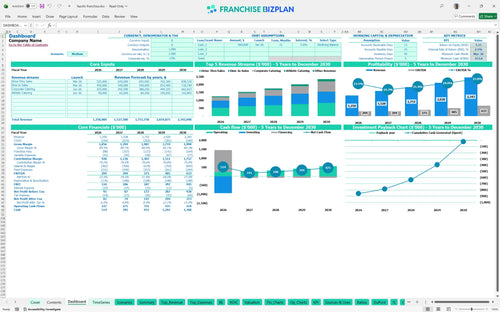
All-in-one Dashboard
Core inputs and core outputs


This restaurant franchise financial projection spreadsheet includes a complete P&L, cash flow statement, and CAPEX schedule to evaluate your investment feasibility.
Core inputs and core outputs
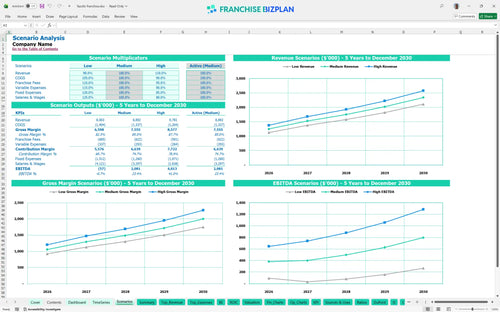
Three scenario analysis
Presentation ready
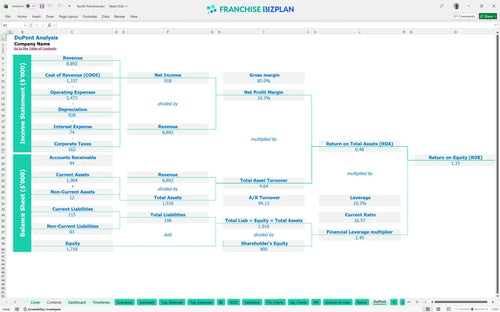
DuPont analysis
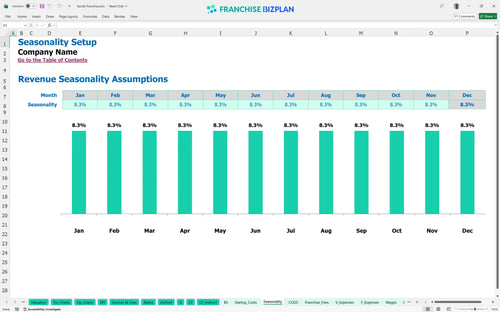
Researched revenue assumptions
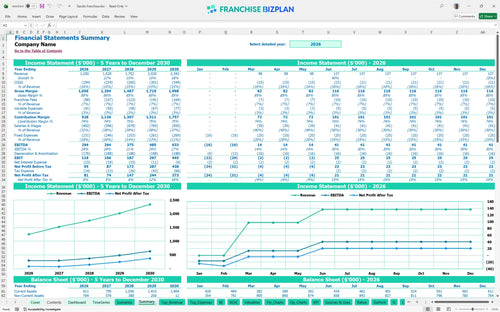
Lender-friendly financial outputs
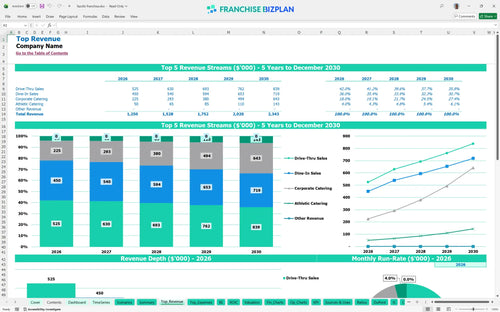
Revenue stream detailed view
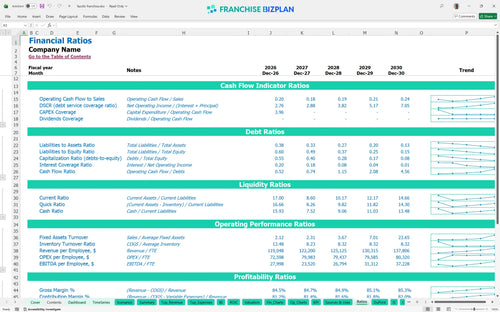
Performance metrics benchmark
We built this franchise unit financial model using detailed research on fast-casual Italian concepts. Key assumptions-including drive-thru volume, $75,000 manager salaries, and $940,000 in startup CAPEX-are pre-populated and fully editable to reflect your specific location. With a Year 1 revenue of $1.25M and a 4-month break-even, the model provides a pragmatic look at your potential unit economics.
The unit reaches profitability quickly, showing a positive EBITDA of $294,000 in the first year. Net profit accelerates as catering revenue matures, with Year 5 EBITDA projected to hit $633,000 as food costs defintely benefit from scale. Here's the quick math: your margin improves as high-margin corporate catering grows from $150,000 to over $428,000 annually.
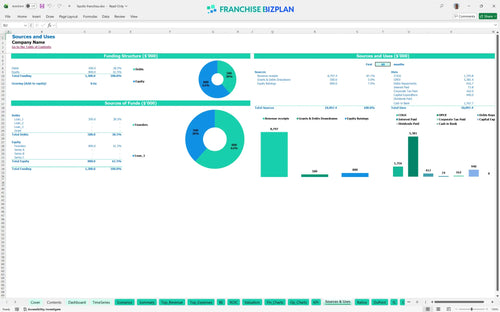
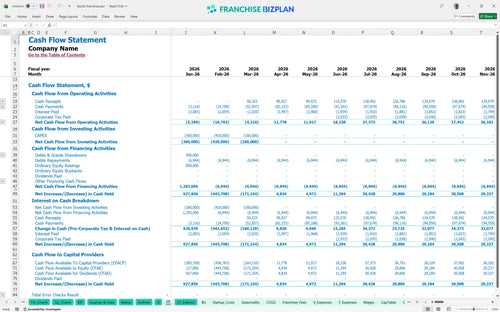
You need approximately $940,000 to launch this unit, with the bulk of funds allocated to leasehold improvements and kitchen equipment. The model assumes you have a $313,000 cash buffer to handle the ramp-up phase through March 2026. This franchise investment calculator ensures you don't under-capitalize the business before the drive-thru and dine-in channels reach full capacity.
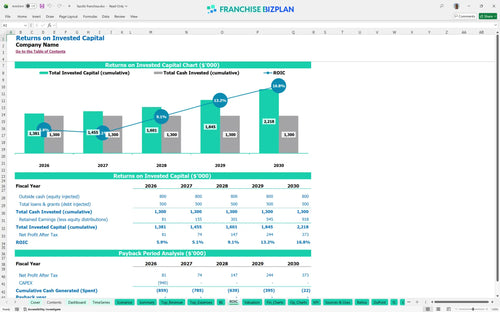
The ROI analysis shows an internal rate of return (IRR) of 2.13% and a return on equity (ROE) of 1.15. While the payback period extends beyond five years, the steady increase in annual EBITDA suggests a strong long-term asset value. What this estimate hides is the potential for multi-unit overhead savings if you scale beyond a single storefront.
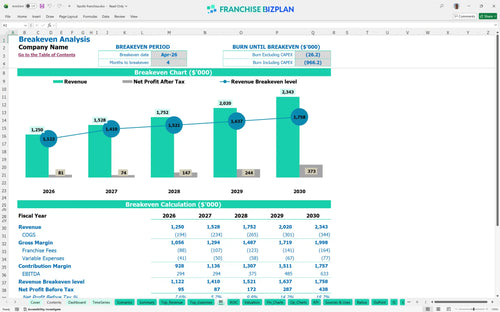
The store hits its monthly break-even point in April 2026, just four months after opening its doors. This rapid turnaround depends on maintaining a $14,000 monthly rent and managing a crew of six members effectively during the launch. Your biggest lever is labor productivity, as wages represent a significant portion of your monthly fixed and variable burden.
The lowest cash point occurs in March 2026 at $313,000, which is your critical safety margin during the grand opening. You'll need to manage the timing of your $40,000 franchise fee and equipment payments to avoid a liquidity crunch. Honestly, keeping a tight grip on pre-opening labor and inventory is the best way to protect this runway.
In a low-revenue scenario, a 10% dip in drive-thru traffic can push your break-even date back by several months and increase your peak cash need. However, estimating catering revenue for restaurant franchise success in the high case can drive Year 5 EBITDA well past the $633,000 mark. The franchise unit profit and loss statement example shows that small wins in average ticket size have a massive impact on the bottom line.
Analyzing restaurant franchise return on investment requires a deep dive into your specific site's lease terms and local labor market. Use this franchise investment feasibility study template to stress-test your assumptions before committing to the $450,000 build-out. Still, the data shows a clear path to a $2.3M revenue target if you execute the catering and drive-thru strategy correctly.
Finance: update unit break-even and payback model by Friday
This franchise financial model is built in Excel with fully editable assumptions, allowing you to swap out local rent, labor rates, and drive-thru volume. It functions as a fast casual restaurant business model template where pre-filled formulas handle the math, so you can focus on testing different 'what-if' scenarios for your specific territory. You can adjust every line item to match your actual operating expenses and local market conditions.

Planning for long-term growth is essential, and this model provides a detailed 5-year roadmap for a single unit or a small multi-unit restaurant franchise. It tracks how revenue scales from an initial $1.25M to over $2.3M by year five, accounting for ramp-up periods and maturing catering streams. The integrated balance sheet and cash flow views ensure you can see the long-term impact of your initial capital expenditure.

This model captures the specific financial obligations required by the franchise disclosure document, including the 5% royalty and 2% marketing fund contributions. By automating these calculations against your monthly sales, the model provides a realistic restaurant profitability analysis that accounts for all brand-level overhead. It ensures you understand the net margin remaining after all franchise-specific costs are paid.

Launching a new location requires a clear understanding of how to calculate franchise startup costs, which total nearly $940,000 in this scenario. The model breaks down the $40,000 franchise fee, $450,000 for leaseholds, and $180,000 for kitchen equipment to help you manage your initial investment. It identifies the exact monthly sales volume needed to cover your $14,000 rent and other fixed costs.

We've included built-in benchmarks for food costs starting at 14% and packaging at 1.5% to help you sanity-check your restaurant franchise operating budget template. These figures allow you to compare your performance against industry standards for labor and occupancy. Use these markers to see how to forecast restaurant labor and food costs accurately while maintaining a competitive store-level margin.


Simply purchase and download the financial model template, then access it instantly using Microsoft Excel or Google Sheets. No installation or technical expertise required-just open and start working.

Enter your business-specific numbers, including revenue projections, costs, and investment details. The pre-built formulas will automatically calculate financial insights, saving you time and effort.

Leverage the investor-ready format to confidently showcase your financial projections to banks, franchise representatives, or investors. Impress stakeholders with clear, data-driven insights and professional reports.

Leverage the investor-ready format to confidently present your projections to banks, franchise representatives, or investors.