
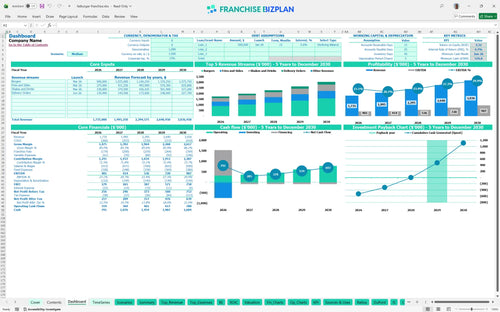
All-in-one Dashboard
Core inputs and core outputs


This Excel template for restaurant franchise financial forecasting provides a comprehensive look at unit economics, from initial build-out to five-year cash flow.
Core inputs and core outputs
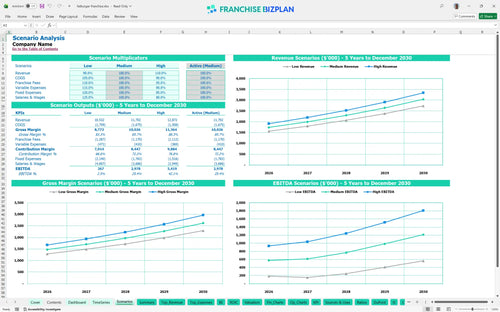
Three scenario analysis
Presentation ready
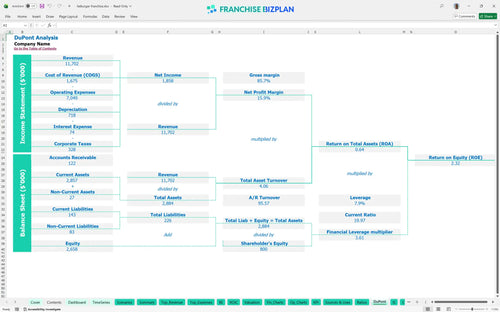
DuPont analysis
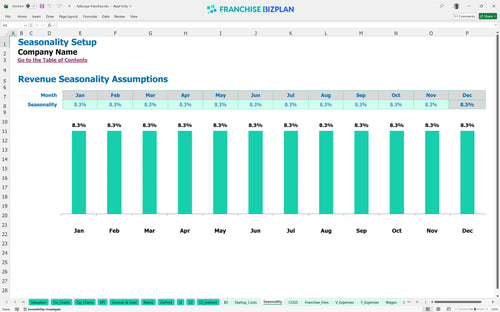
Researched revenue assumptions
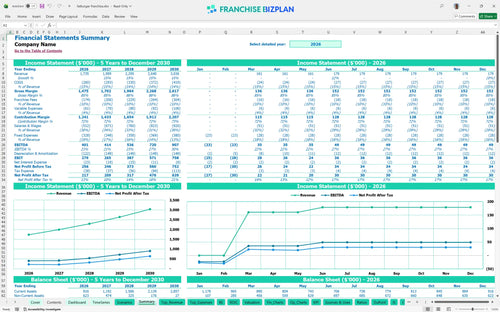
Lender-friendly financial outputs
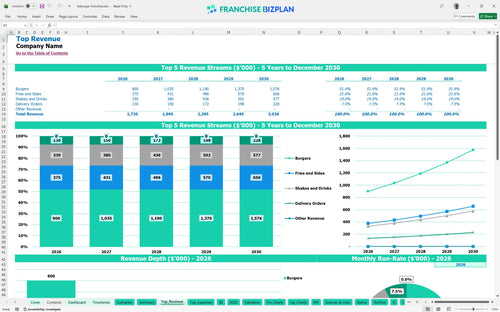
Revenue stream detailed view
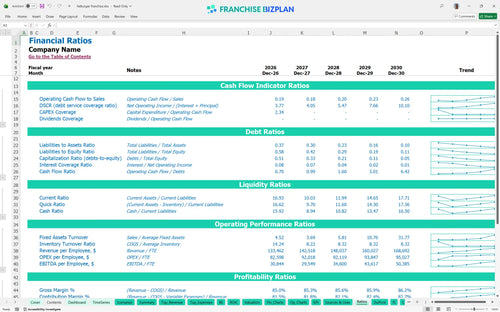
Performance metrics benchmark
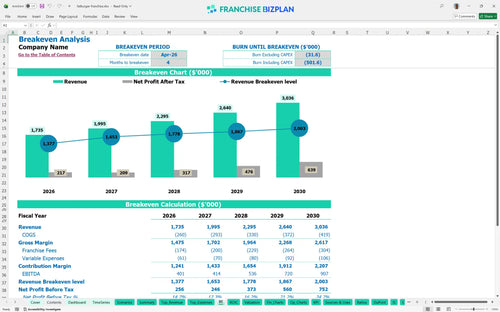
We built this franchise unit financial model using detailed market research to help you evaluate a high-volume burger concept. The pre-populated assumptions for revenue streams like burgers and shakes, along with a 6% royalty fee, provide a realistic view of store-level performance. With Year 1 revenue projected at $1,735,000 and EBITDA at $401,000, this model serves as a robust franchise profitability analysis tool for your investment committee.
This unit hits profitability in April 2026, just four months after opening its doors. By Year 1, you are looking at an EBITDA (earnings before interest, taxes, depreciation, and amortization) of $401,000 after accounting for a 10% total fee load and food costs that start at 13%. Profit lives in the gap between labor and food costs.
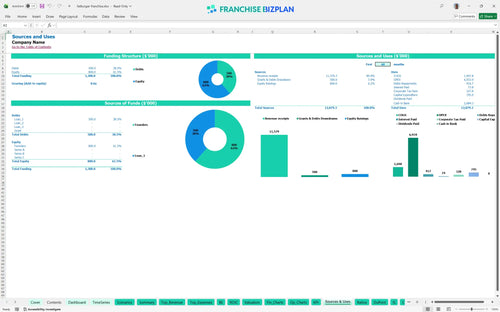
How to calculate startup costs for a burger franchise starts with the $745,000 hard cost for build-out and equipment. You also need to account for the $50,000 franchise fee and a minimum cash reserve of $576,000 to handle the ramp-up. Cash is king, but equipment makes the burger.
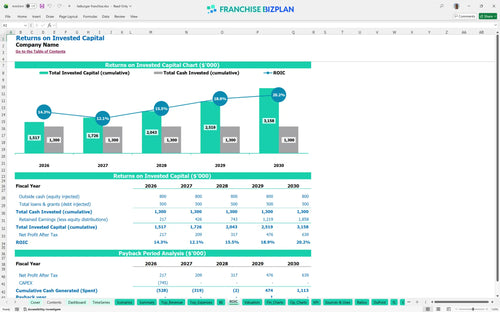
The return on investment calculation shows an IRR (Internal Rate of Return) of 4.66% with a full payback achieved in 4 years. While the initial return seems modest, the unit economics analysis shows revenue scaling from $1.7M to $3M, which builds significant equity value. Time is the most expensive ingredient in your ROI.
Your monthly operating budget template for fast casual franchise shows you need to clear the break-even point by Month 4. With rent at $20,000 and a $75,000 manager salary, throughput is the only way to cover these fixed obligations. Speed to break-even determines your survival.
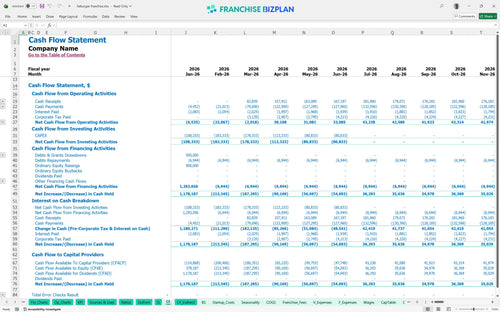
The franchise unit cash flow projection spreadsheet identifies June 2026 as your lowest cash point at $576,000. This is the valley of death where construction bills and initial labor costs collide before revenue fully scales. A thin cash buffer is a recipe for a shutdown.
Comparing scenarios shows that even a 5% dip in revenue can push your payback out by a year. Estimating labor costs for late-night restaurant operations is tricky, and if crew costs spike, your Year 1 margin will defintely take a hit. Planning for the worst makes the best case possible.
Finance: update unit break-even and payback model by Friday.
This franchise unit financial model is fully customizable in Excel, featuring pre-filled formulas and editable assumptions that allow you to adapt the numbers to your specific territory and local market conditions. You can adjust everything from hourly wages to burger prices, ensuring the projections reflect your actual operating scenario. One point of margin leak can sink a single-unit model, so having total control over the inputs is vital for accuracy.

Long-term planning is built into the model with detailed 5-year revenue, cost, and cash flow projections tailored for a high-volume food franchise unit. The spreadsheet tracks your growth from an initial $1.73 million in Year 1 to over $3 million by Year 5, helping you visualize the scaling process. Growth is a marathon, not a sprint, and these projections show exactly how the unit matures over time.

The model accurately captures franchise-specific obligations, including the 6% royalty fee and 4% brand marketing fund contribution, so you understand the real economics of the brand. By mapping these ongoing costs against your gross margin, you can see how much cash actually stays in your pocket after the franchisor takes their cut. Fees are the price of brand power, but they must be managed against store-level overhead.

Planning your initial investment is simplified with a franchise startup cost spreadsheet that covers build-out, equipment, and the initial franchise fee. The model helps you identify the exact sales level required to cover both fixed and variable costs, providing a clear path to self-sufficiency. Knowing your zero-profit point is the first step to real wealth in the restaurant business.

This tool incorporates built-in industry benchmarks for labor, rent, and COGS (Cost of Goods Sold) to help you sanity-check your assumptions against typical fast-casual performance. If your labor costs are projected at 30% but the benchmark is 25%, the model flags the discrepancy so you can adjust your staffing plan. Don't guess when you can benchmark your unit economics analysis against real-world standards.


Simply purchase and download the financial model template, then access it instantly using Microsoft Excel or Google Sheets. No installation or technical expertise required-just open and start working.

Enter your business-specific numbers, including revenue projections, costs, and investment details. The pre-built formulas will automatically calculate financial insights, saving you time and effort.

Leverage the investor-ready format to confidently showcase your financial projections to banks, franchise representatives, or investors. Impress stakeholders with clear, data-driven insights and professional reports.

Leverage the investor-ready format to confidently present your projections to banks, franchise representatives, or investors.