
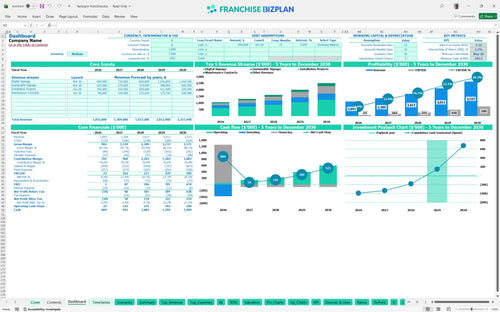
All-in-one Dashboard
Core inputs and core outputs


This comprehensive signage shop business plan excel includes automated financial statements, a detailed CAPEX schedule, and a multi-scenario revenue driver for custom visual solutions.
Core inputs and core outputs
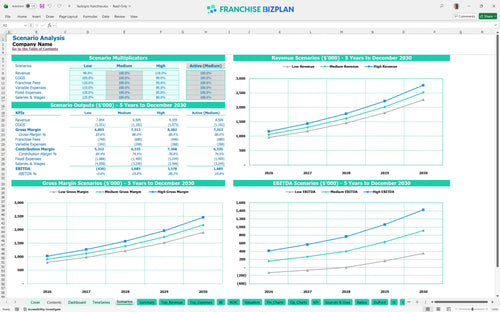
Three scenario analysis
Presentation ready
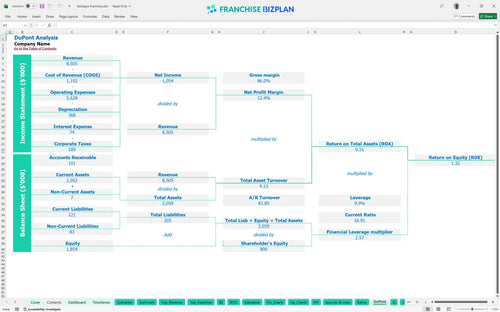
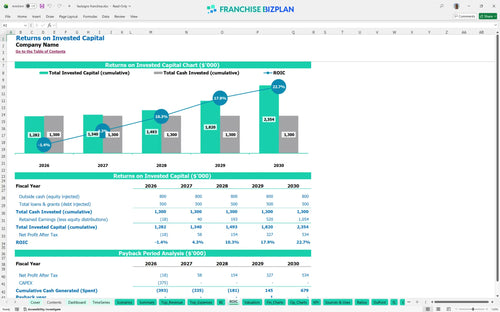
DuPont analysis
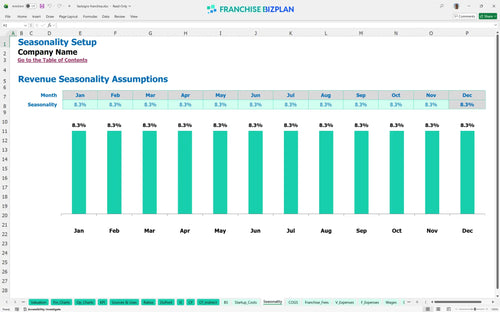
Researched revenue assumptions
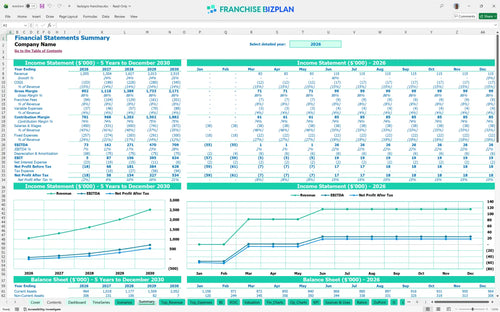
Lender-friendly financial outputs
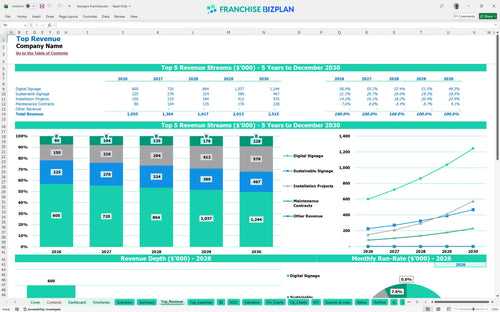
Revenue stream detailed view
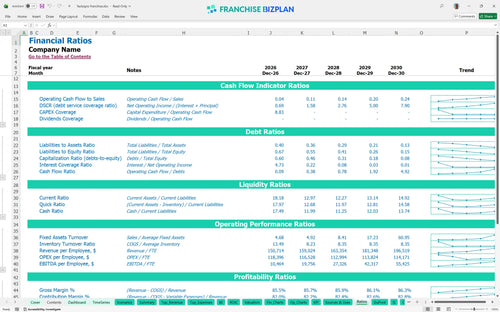
Performance metrics benchmark
We developed this signage franchise unit financial model through deep research into the visual communications sector. Key assumptions like the $1.05M year-one revenue target and the 6% royalty rate are pre-populated and ready for your specific location data. This tool helps you move from 'what if' to a concrete execution plan with data-driven confidence.
The unit reaches profitability quickly, showing a positive EBITDA of $73,000 in the first year. By year five, as you scale maintenance contracts and installation projects, EBITDA is projected to climb to $709,000. Analyzing profit margins for a signage franchise shows that as revenue grows 138% over five years, fixed costs like the $15,000 rent become a much smaller slice of the pie.
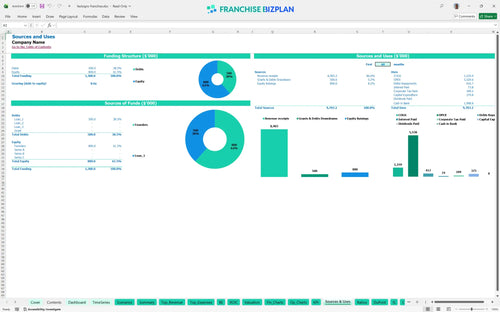
You will need approximately $374,750 for the initial setup, covering the franchise fee, equipment, and build-out. This includes $70,000 for printers and $120,000 for leasehold improvements in a prime location. Startup investment requirements for sign company owners also include a cash buffer to handle the ramp-up phase before the June 2026 break-even point. Here is the quick math: your equipment and fees are the biggest upfront hurdles.
The model shows a 3.49% Internal Rate of Return (IRR) and a Return on Equity (ROE) of 1.32. You can expect a full payback on your initial investment within 4 years. While the IRR seems conservative, it reflects a realistic ramp-up in a competitive commercial market. How to evaluate franchise profitability often comes down to this: are the steady year-5 cash flows worth the upfront 4-year wait?
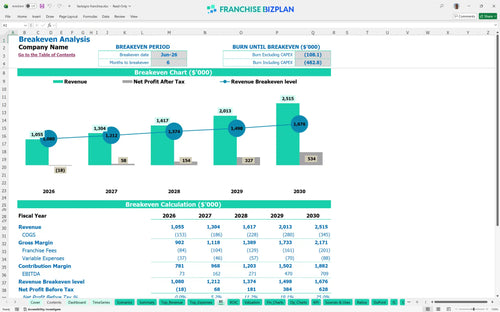
The unit hits its monthly break-even point in June 2026, just 6 months after launching. This assumes you hit your targets for digital signage and installation projects early on. Signage franchise unit financial forecasting suggests that managing your $22,500 monthly fixed overhead is the biggest lever for reaching this milestone. If your $15,000 rent is higher, your break-even volume moves up accordingly.
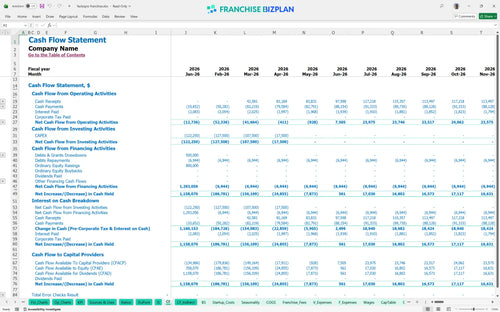
The lowest cash point occurs in May 2026, with a minimum cash balance of $782,000 (including your initial funding). This indicates you need a healthy liquidity cushion to survive the first 5 months of operations. This excel financial template for custom sign business owners helps you visualize exactly when the bank account starts growing again. To be fair, a small delay in a large installation project could tighten this runway fast.
The model allows you to toggle between Low, Medium, and High growth cases to see the impact on your $73,000 year-one EBITDA. In a high-growth scenario, hitting $1.2M in year one significantly shortens the payback period. Financial projections for commercial signage franchise units show that even a 10% drop in revenue can delay break-even by several months. It's a business model template for printing and sign shops that rewards high-volume B2B sales execution.
This signage franchise financial model is built entirely in Excel, giving you total control over the numbers. We've pre-filled the formulas and assumptions, but you can easily tweak them to fit your specific territory or local market conditions. It is a flexible franchise startup cost template that lets you swap out rent, labor rates, or equipment costs without breaking the logic. Still, the core structure remains intact so you don't have to be an Excel wizard to get professional results.

Planning for the long haul requires more than just a year-one guess. This tool provides detailed franchise unit financial projections covering five years of growth, from your first digital signage sale to mature maintenance contracts. It maps out how operating expense forecasting shifts as you scale from $1.05M in year one to over $2.5M by year five. Honestly, seeing the five-year horizon helps you decide if the long-term equity build matches your personal goals.

We built the franchise royalty structure directly into the cash flow logic so you never miss a payment. With a 6% royalty and a 2% marketing fund contribution, the model automatically calculates these off your gross sales. This ensures your unit economics stay realistic by accounting for every dollar that leaves the shop before you pay your own bills. It's the best way to see how brand fees impact your bottom line as volume grows.

Knowing how to calculate startup costs for a signage franchise is the first step to avoiding a cash crunch. Our model aggregates everything from the $49,750 initial fee to the $120,000 in leasehold improvements. By performing a rigorous break-even analysis, you can identify the exact month when your digital and sustainable signage sales cover your $15,000 monthly rent and $22,000+ in monthly fixed costs. Every dollar of margin helps you get to that zero-point faster.

This signage business profitability analysis uses real-world benchmarks to keep your plan grounded in reality. We've included capital expenditure planning for high-end items like $70,000 large format printers and $35,000 AR studios. By comparing your projected 12.5% raw material costs against industry standards, you can defintely spot where you might be overspending. It acts as a sanity check for your store-level margins before you sign a lease.


Simply purchase and download the financial model template, then access it instantly using Microsoft Excel or Google Sheets. No installation or technical expertise required-just open and start working.

Enter your business-specific numbers, including revenue projections, costs, and investment details. The pre-built formulas will automatically calculate financial insights, saving you time and effort.

Leverage the investor-ready format to confidently showcase your financial projections to banks, franchise representatives, or investors. Impress stakeholders with clear, data-driven insights and professional reports.

Leverage the investor-ready format to confidently present your projections to banks, franchise representatives, or investors.