
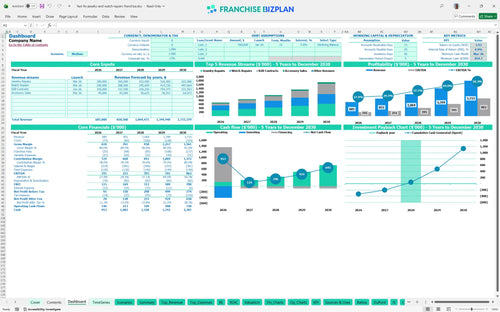
All-in-one Dashboard
Core inputs and core outputs


This comprehensive Excel spreadsheet for franchise unit financial planning includes researched revenue streams, CAPEX schedules, and multi-year P&L statements designed specifically for the jewelry and watch repair sector.
Core inputs and core outputs
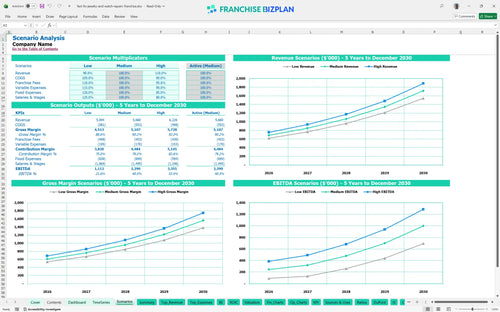
Three scenario analysis
Presentation ready
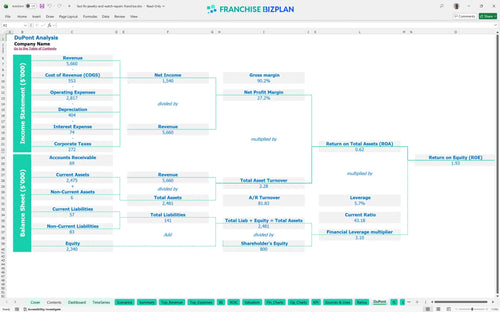
DuPont analysis
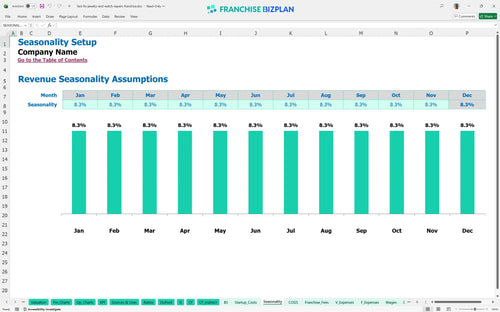
Researched revenue assumptions
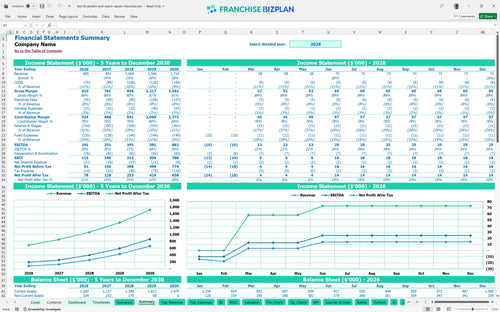
Lender-friendly financial outputs
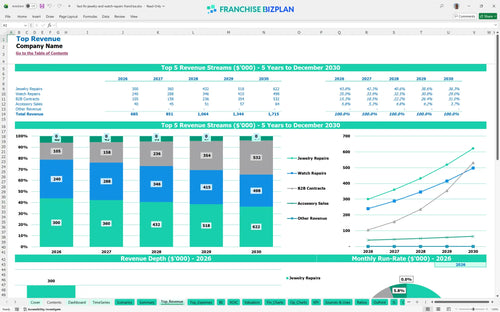
Revenue stream detailed view
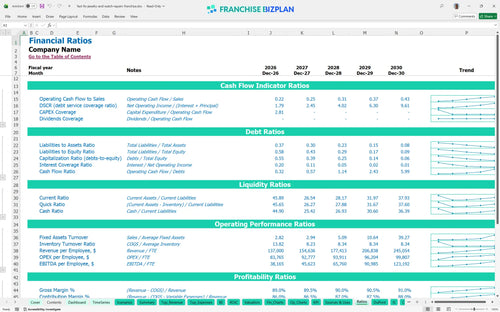
Performance metrics benchmark
We built this franchise unit financial model using detailed research on the repair industry. Key assumptions like the $410,000 initial CAPEX, 6% royalty fees, and specialized technician payroll are pre-populated and fully editable. The model shows a strong growth path with Year 1 EBITDA starting at $191,000 and scaling as you build local B2B repair contracts.
The unit is projected to reach profitability quickly, showing a positive EBITDA of $191,000 in the first year. This trajectory is defintely driven by high-margin jewelry and watch repair services that offset the fixed mall occupancy costs. By Year 3, EBITDA is expected to double as the customer base matures and B2B contract revenue scales.
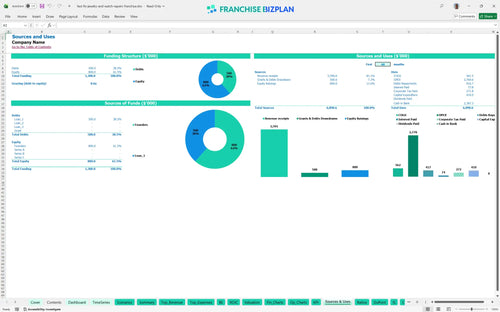
You will need approximately $410,000 for the initial build-out and equipment, plus a significant cash buffer, bringing the minimum cash requirement to $855,000. The primary uses of capital include the specialized repair theater construction and high-end diagnostic tools. This ensures you have the technical capacity to handle luxury brands like Rolex from day one.
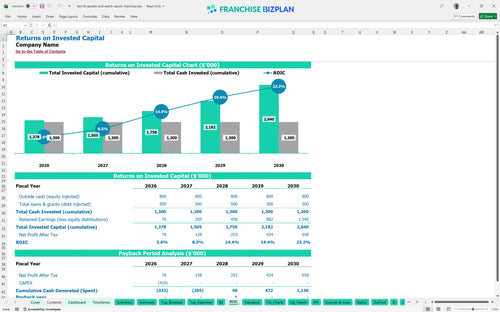
Investors can expect a 3-year payback period on their initial capital. The model forecasts an Internal Rate of Return (IRR) of 4.95% and a Return on Equity (ROE) of 1.93. While the initial investment is high due to specialized equipment, the long-term cash flow reaches $862,000 in annual EBITDA by Year 5, providing a strong valuation multiple.
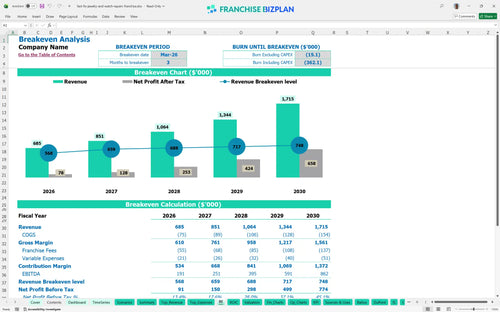
The unit is projected to hit its monthly break-even point in March 2026, just 3 months after launch. The main driver for this is the high average ticket price for specialized repairs compared to the fixed monthly costs of $11,000 for rent and insurance. Maintaining high foot traffic in the mall is the critical lever for staying above this line.
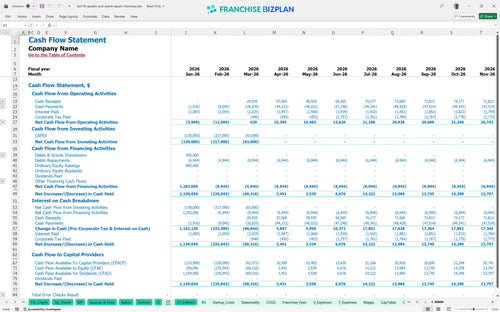
The lowest cash point occurs in March 2026 at $855,000 during the final stages of the ramp-up. You need enough runway to cover the $16,000+ monthly technician payroll before the repair volume fully matures. A cash buffer is recommended to handle any delays in mall construction or equipment delivery that could push back the launch date.
In the High scenario, aggressive B2B growth and high-ticket luxury repairs can push Year 1 revenue well beyond the $685,000 baseline. The Low scenario accounts for slower mall foot traffic, which would extend the payback period beyond 3 years. The model allows you to stress-test how a 10% drop in repair volume impacts your ability to cover the 8% total franchise fees.
Finance: update unit break-even and payback model by Friday.
This franchise unit financial model is built in Excel to give you total control over your projections. You can adjust pre-filled formulas and editable assumptions to match your specific mall location, local labor rates, and repair volume expectations. It is a flexible franchise startup cost calculator that lets you toggle different operating scenarios to see how they impact your bottom line.

Success in retail repair requires looking beyond the grand opening. This model provides a detailed 5-year roadmap, showing revenue scaling from $685,000 in Year 1 to over $1.7 million by Year 5. You get a full view of long-term profitability, including cash flow and balance sheet projections, which is essential for any retail franchise profitability analysis.

Operating within a system means accounting for specific brand obligations. The model tracks the $40,000 initial franchise fee along with the ongoing 6% royalty and 2% marketing fund contributions. This ensures your franchise investment projection template reflects the actual cash leaving the business to support the brand's ecosystem and regional advertising efforts.

Launching a specialized repair unit requires significant upfront capital for technical infrastructure. This model aggregates your $410,000 in capital expenditures, including the repair theater build-out and laser equipment, to determine your break-even point analysis. You will know exactly what monthly sales volume is required to cover your $7,500 mall rent and master technician salaries.

We include industry-standard benchmarks so you can verify if your costs are realistic. Whether you are assessing the profitability of a jewelry repair franchise or estimating revenue for a new retail franchise location, these benchmarks help you sanity-check your 10% parts cost and labor percentages. It ensures your unit economics analysis aligns with high-performing service-based retail units.


Simply purchase and download the financial model template, then access it instantly using Microsoft Excel or Google Sheets. No installation or technical expertise required-just open and start working.

Enter your business-specific numbers, including revenue projections, costs, and investment details. The pre-built formulas will automatically calculate financial insights, saving you time and effort.

Leverage the investor-ready format to confidently showcase your financial projections to banks, franchise representatives, or investors. Impress stakeholders with clear, data-driven insights and professional reports.

Leverage the investor-ready format to confidently present your projections to banks, franchise representatives, or investors.