
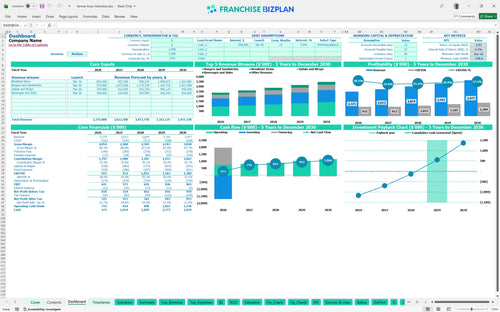
All-in-one Dashboard
Core inputs and core outputs


This toolkit provides a restaurant franchise financial model Excel template featuring a restaurant P&L statement, cash flow analysis, and detailed CAPEX tracking for a complete franchise investment analysis.
Core inputs and core outputs
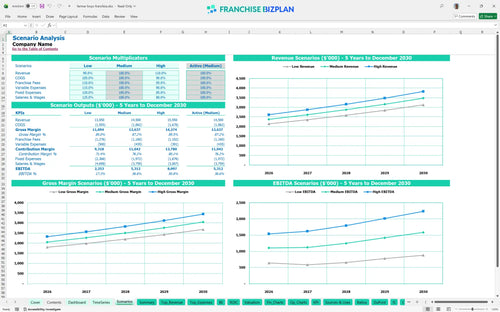
Three scenario analysis
Presentation ready
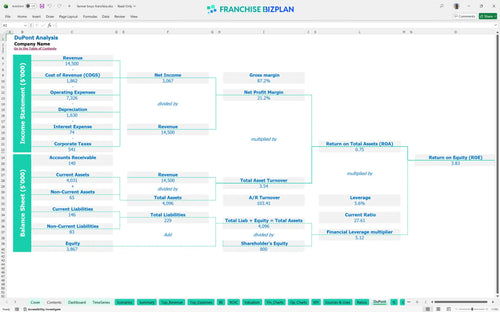
DuPont analysis
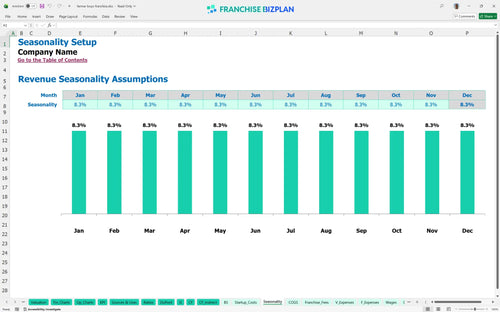
Researched revenue assumptions
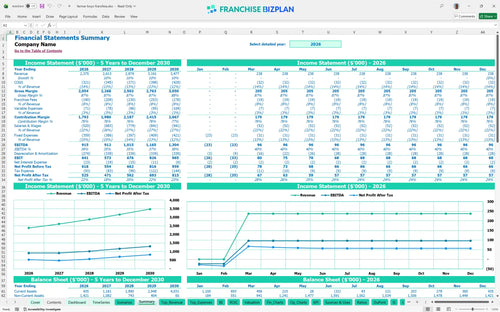
Lender-friendly financial outputs
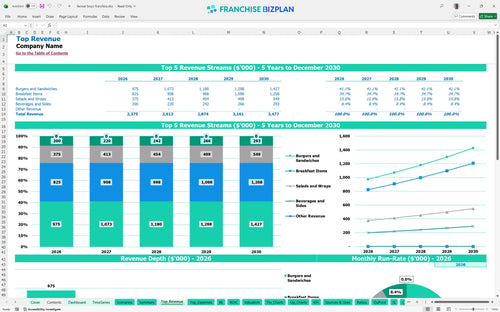
Revenue stream detailed view
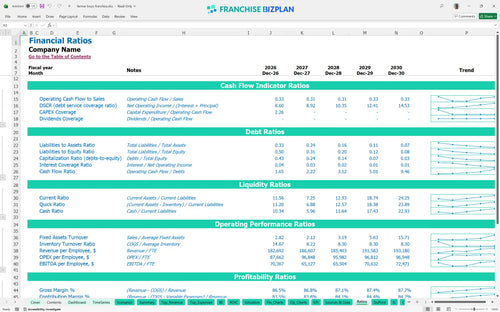
Performance metrics benchmark
We built this franchise unit financial model using our own research into the fast-casual and drive-thru sectors. Key assumptions, including the $2.3M opening year revenue and the $1.6M+ startup cost, are pre-populated with researched data specific to this high-volume concept and are fully editable. This model helps you evaluate how to calculate startup costs for a fast-casual franchise while tracking a 4-year payback period and a 4.24% IRR.
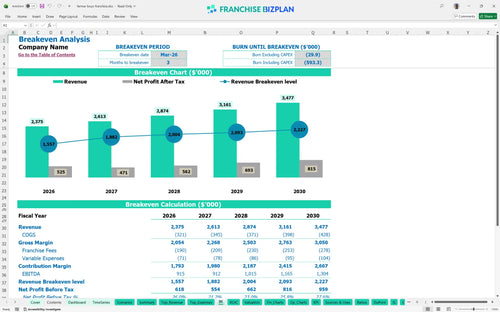
The unit reaches operational profitability almost immediately, with a formal break-even date in March 2026. While Year 1 EBITDA is a strong $915,000, net profit grows steadily as food ingredient costs are optimized from 11.5% down to 10.3% by Year 5.
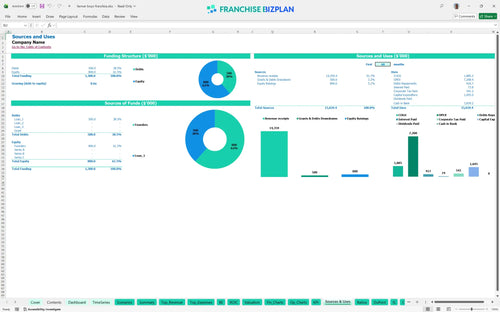
You need approximately $1,695,000 to launch, covering the $45,000 franchise fee and $850,000 in leasehold improvements. This investment also includes $320,000 for kitchen equipment and $180,000 for drive-thru technology to ensure maximum speed of service.
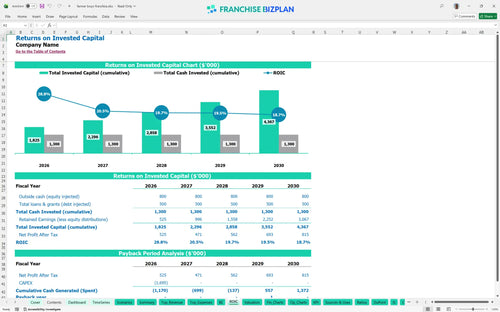
Franchisees can expect a 4-year payback period on the total initial capital investment. The model projects an Internal Rate of Return (IRR) of 4.24% and a Return on Equity (ROE) of 3.83%, reflecting the stable, long-term nature of this asset class.
The unit hits its monthly break-even point in month 3 of operations. The primary driver is the $20,000 monthly rent; you must maintain high volume in burgers and sandwiches to cover this fixed occupancy cost and the 8% combined royalty burden.
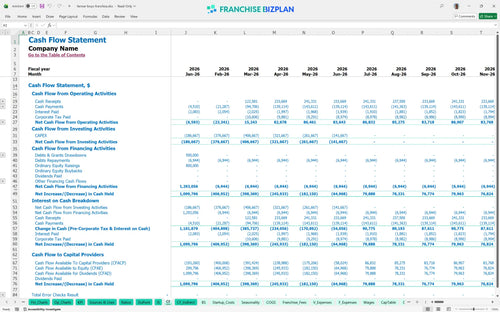
The lowest cash point occurs in June 2026, where the balance dips to -$199,000 during the ramp-up phase. You defintely need a dedicated working capital buffer to handle the gap between construction completion and the stabilization of daily cash receipts.
A High Case scenario, driven by a 10% revenue lift, can shorten the payback period to under 3.5 years. Conversely, the Low Case shows that if labor costs spike or revenue stalls at $2.3M, the peak cash need deepens, requiring more initial liquidity.
This franchise financial model lives in Excel, giving you full control over every variable from burger pricing to shift supervisor wages. You can adjust pre-filled formulas to test how a 2% bump in food costs or a change in drive-thru speed impacts your bottom line. It is designed to handle the specific nuances of a fast-casual franchise business plan without needing a degree in finance. Every cell is open, so you can tweak the 11.5% food cost assumption as your local supply chain matures. One-click adjustments make this the ultimate tool for stress-testing your assumptions.

Success in the fast-casual space requires looking past the grand opening to see how the unit scales. This tool provides a detailed 5-year franchise financial forecasting view, projecting revenue to grow from $2,375,000 in year one to over $3,477,000 by year five. By mapping out long-term cash flow and profit, you can plan for equipment refreshes and debt service while maintaining a clear view of your store-level EBITDA. The model tracks how your margins evolve as food costs drop from 11.5% to 10.3% over five years. Long-term planning turns a single unit into a sustainable legacy business.

Royalties and marketing funds are the brand tax that buys you national recognition, but they must be managed carefully at the unit level. This model automatically calculates the 5% royalty and 3% marketing fee against your gross sales, ensuring you see the exact impact on your net margin. Tracking these ongoing franchise costs alongside the initial $45,000 franchise fee helps you understand the true cost of the brand's support system. At $2.3M in sales, you are looking at $184,000 in annual fees before you even pay for light bulbs. Clear fee tracking prevents end-of-month cash flow surprises.

Launching a high-volume restaurant requires significant upfront capital, often exceeding $1.6M when including leasehold improvements and kitchen gear. Our break-even analysis template identifies the exact sales volume needed to cover your $20,000 monthly rent and fixed restaurant operating expenses. Knowing your break-even point helps you set realistic targets for your management team during the critical first six months of operation. The model shows you exactly how many $15 tickets you need to sell to keep the lights on. Precision in your startup cost breakdown for a drive-thru restaurant franchise is the best hedge against risk.

Do not guess if your labor costs are too high; use the built-in benchmarks to verify your performance against the sector. The model includes typical ranges for food ingredients and packaging to help you spot margin leaks early. Comparing your unit's performance against these industry standards ensures your franchise unit profit and loss template reflects reality rather than optimism. If your kitchen staff costs exceed the projected $144,000 in year one, you will know exactly where to trim. Benchmarks provide the sanity check every new operator needs.


Simply purchase and download the financial model template, then access it instantly using Microsoft Excel or Google Sheets. No installation or technical expertise required-just open and start working.

Enter your business-specific numbers, including revenue projections, costs, and investment details. The pre-built formulas will automatically calculate financial insights, saving you time and effort.

Leverage the investor-ready format to confidently showcase your financial projections to banks, franchise representatives, or investors. Impress stakeholders with clear, data-driven insights and professional reports.

Leverage the investor-ready format to confidently present your projections to banks, franchise representatives, or investors.