
All-in-one Dashboard
Core inputs and core outputs


This franchise unit financial model template is a pre-written financial template for franchise owners that includes detailed projections for a high-volume BBQ restaurant, covering everything from pit smokers to catering revenue.
Core inputs and core outputs
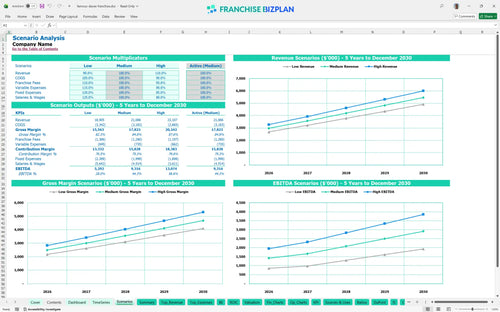
Three scenario analysis
Presentation ready
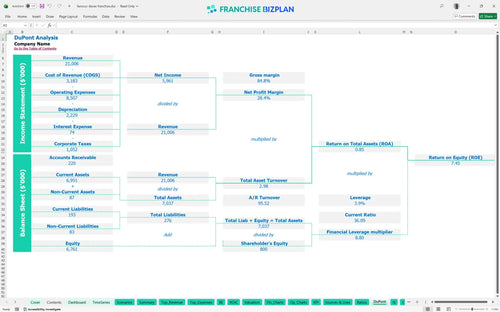
DuPont analysis
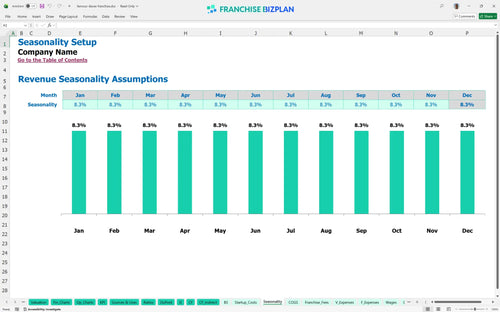
Researched revenue assumptions
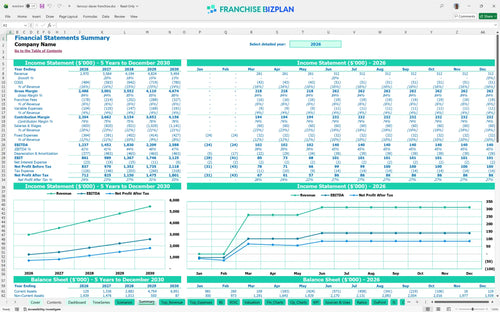
Lender-friendly financial outputs
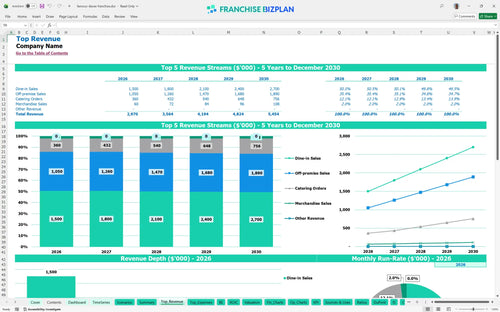
Revenue stream detailed view
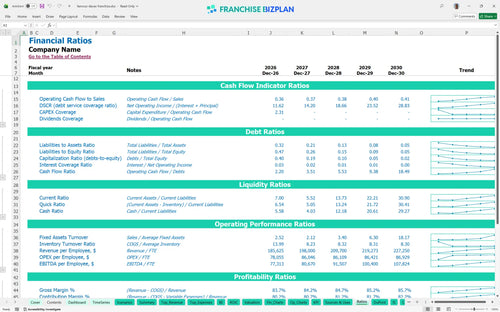
Performance metrics benchmark
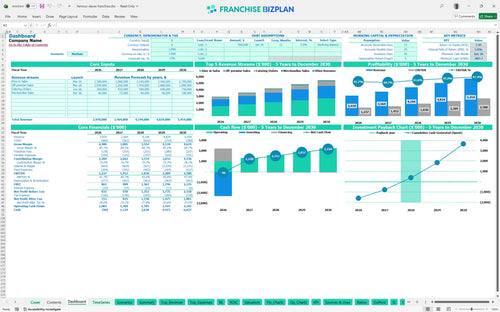
We built this franchise unit financial model using our own research to ensure it reflects the reality of operating a high-volume BBQ concept. Key assumptions like the $2.97M year-one revenue and $1.2M build-out cost are pre-populated and fully editable to match your specific territory. This is the roadmap for your first five years.
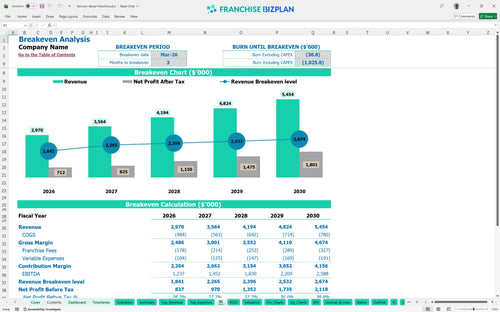
Based on the researched data, this unit hits its break-even date in March 2026, just three months after opening. This franchise profitability analysis shows year-one EBITDA starting at $1.23M and climbing to $2.58M by year five as catering and off-premise sales ramp up. Profitability is a marathon, not a sprint.
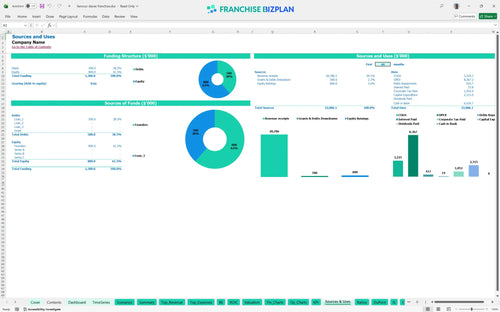
You will need a significant capital expenditure budget to launch this unit, with leasehold improvements and store design alone costing $1.2M. The restaurant franchise startup budget spreadsheet covers the $45,000 franchise fee, $350,000 for specialized smokers, and $60,000 for the tech stack. Cash is king, but allocation is the kingdom.
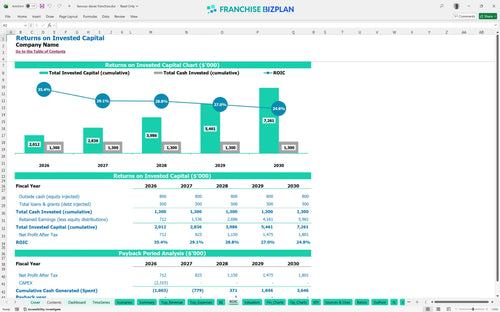
The franchise investment calculator shows an Internal Rate of Return (IRR) of 4.97% and a Return on Equity (ROE) of 7.45%. While the initial outlay is high, the 3-year payback period is reasonable for a high-volume casual dining model with multi-revenue streams. ROI tells you if the risk is worth the reward.
Your monthly break-even depends heavily on managing the $20,000 prime location rent and the 14.5% food cost. Evaluating profitability of a retail food franchise requires driving high-volume traffic through the pickup window to cover these fixed monthly overheads. Break-even is the first major milestone of any unit.
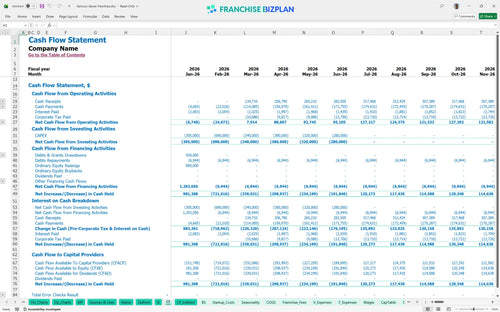
The lowest cash point occurs in June 2026, with a deficit of $804,000, which means you need a solid working capital buffer during the build-out. This franchise unit cash flow projection template shows that if construction takes longer than planned, cash pressure will defintely mount quickly. The lowest cash point is your most vulnerable moment.
Financial planning for multi-revenue stream franchises involves testing how a 10% drop in dine-in sales affects your ability to service debt. The model allows you to compare Low, Medium, and High scenarios to see how pricing and labor productivity change your year-one margin. Scenarios prepare you for the reality of the market.
This franchise financial model template is built in Excel with open formulas, so you can tweak every assumption to fit your specific market. Whether you are adjusting for a smaller footprint or a high-traffic urban site, the editable inputs for revenue and expenses keep your planning accurate. Every 1-point margin leak matters fast in a single-unit model.

Planning for a BBQ restaurant franchise requires looking beyond the first year to understand how scaling affects your bottom line. This restaurant franchise business plan provides a full 5-year outlook on revenue, EBITDA, and cash flow to help you secure financing and set long-term growth targets. Long-term planning is the difference between a job and an investment.

At $2.97M in year-one sales, a 5% royalty and 1% marketing fee mean $178,200 goes to the brand before you pay a single employee. This tool focuses on analyzing franchise royalty and marketing fund payments alongside the initial $45,000 franchise fee so you see the true cost of the brand's support. Royalties are a top-line tax you can't ignore.

Launching a BBQ restaurant franchise involves heavy upfront costs, from $1.2M in leasehold improvements to $350,000 for pit smokers. This model helps you with how to calculate startup costs for a restaurant franchise, helping you estimate the exact sales volume needed to cover these fixed costs. Knowing your break-even keeps you from flying blind.

We have integrated industry standards for food costs and labor to help you sanity-check your BBQ restaurant financial projections. If your food ingredients are hitting 14.5%, you can use these benchmarks to see where you might have a margin leak compared to typical ranges. Benchmarks are the guardrails for your expectations.


Simply purchase and download the financial model template, then access it instantly using Microsoft Excel or Google Sheets. No installation or technical expertise required-just open and start working.

Enter your business-specific numbers, including revenue projections, costs, and investment details. The pre-built formulas will automatically calculate financial insights, saving you time and effort.

Leverage the investor-ready format to confidently showcase your financial projections to banks, franchise representatives, or investors. Impress stakeholders with clear, data-driven insights and professional reports.

Leverage the investor-ready format to confidently present your projections to banks, franchise representatives, or investors.