
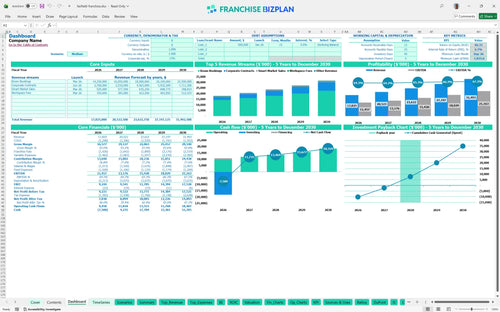
All-in-one Dashboard
Core inputs and core outputs


This franchise unit business plan template provides a complete dynamic dashboard, integrated financial statements, and detailed sub-schedules for a professional-grade hospitality analysis.
Core inputs and core outputs
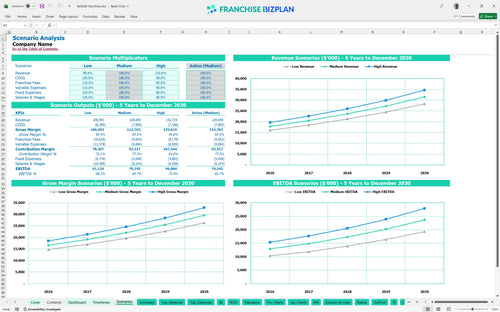
Three scenario analysis
Presentation ready
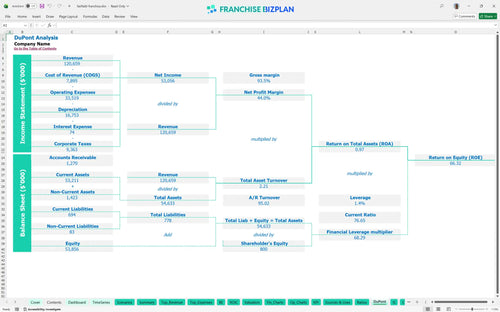
DuPont analysis
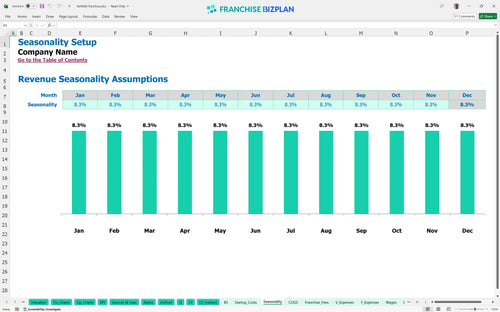
Researched revenue assumptions
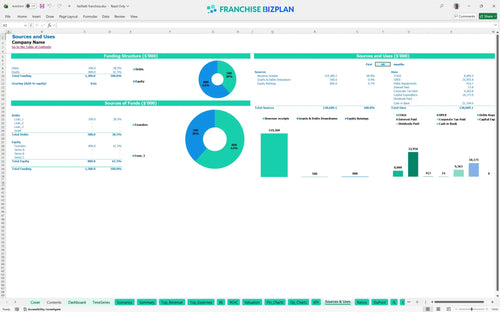
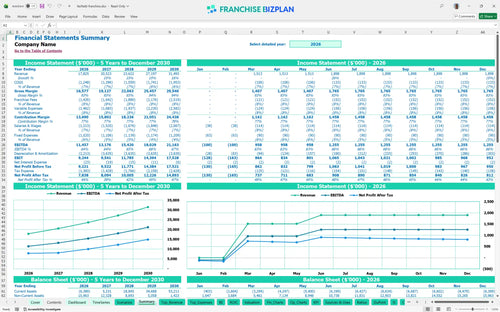
Lender-friendly financial outputs
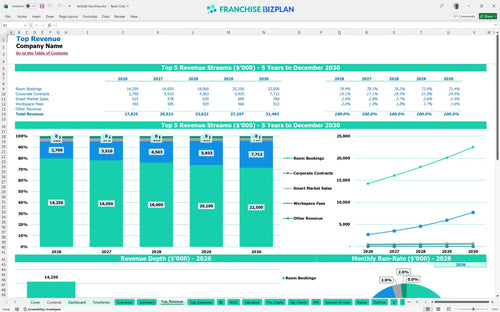
Revenue stream detailed view
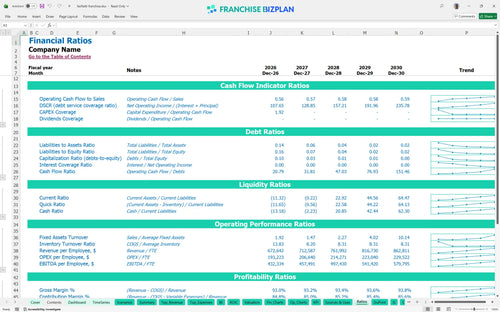
Performance metrics benchmark
We developed this model using our own research into hospitality unit economics and franchise disclosure document analysis. Key assumptions like the $17.8 million year-one revenue and the 5.5% royalty fee are pre-populated with researched data specific to the Fairfield Franchise franchise unit and are fully editable. This tool helps you move from guessing to knowing your potential EBITDA (earnings before interest, taxes, depreciation, and amortization).
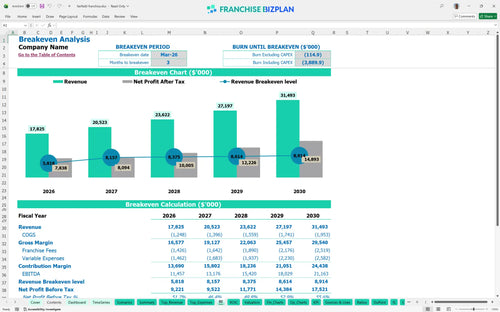
The model shows the unit hitting its break-even date in March 2026, just three months after launch. By year one, you are looking at an EBITDA of $11.4 million after accounting for the 8% total franchise fee burden and $45,000 monthly rent.
You need a significant capital stack to cover the $12 million in leasehold improvements and $2.5 million for furniture and fixtures. The total initial investment also includes a $75,000 franchise fee and $800,000 in pre-opening expenses to ensure a smooth ramp-up.
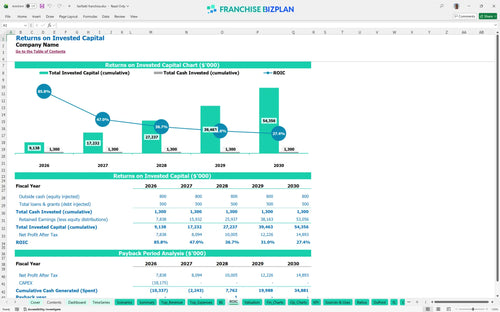
Using this franchise ROI calculator, you can see an Internal Rate of Return (IRR) of 6.67% and a Return on Equity (ROE) of 66.32%. The payback period is estimated at 3 years, which is quite fast for a heavy-asset hospitality play of this scale.
You reach break-even in month 3, requiring enough revenue to cover $45,000 in monthly rent and a $110,000 annual GM salary. Revenue per available room forecasting is the key driver here, as room bookings are projected at $9.5 million in the first year.
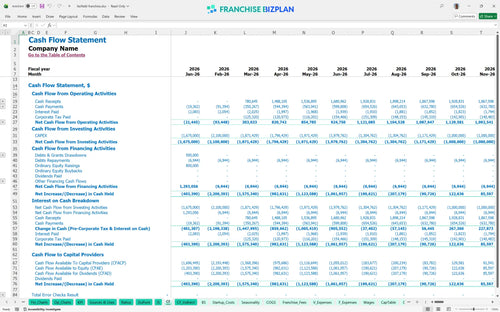
The lowest cash point hits in September 2026 at negative $7.8 million, reflecting the heavy CAPEX phase. You defintely need a robust financing plan or cash reserve to bridge the gap between construction spend and stabilized room revenue during the first year.
Moving to a High scenario can significantly boost your year-5 revenue from the base $31.4 million. While fixed costs like the $8,000 monthly property tax stay steady, higher occupancy improves your year-1 margin by spreading labor costs across more available rooms.
Finance: update unit break-even and payback model by Friday
This hotel franchise financial model is built entirely in Excel, allowing you to swap out every assumption from room rates to local labor costs. You can adjust the pre-filled formulas to match your specific territory or site-specific construction bids to ensure the math fits your reality.

Map out your long-term strategy with a hotel franchise profitability projection that scales from year one through year five. The model tracks how revenue grows from $17.8 million to over $31.4 million as corporate contracts and room bookings mature, providing a clear view of your long-term cash flow and balance sheet health.

Managing the franchise royalty fee structure is critical for maintaining store-level margins. This tool calculates the 5.5% royalty and 2.5% marketing fee automatically against your projected revenue streams, providing a detailed hotel operating expenses breakdown so you can see exactly how much goes to the franchisor.

Use the hotel startup cost calculator to estimate the heavy lift of $12 million in leasehold improvements and $2.5 million in furniture. Knowing your break-even point-estimated here at month 3-is vital for survival, helping you understand the exact sales level required to cover both fixed and variable costs.

This franchise investment analysis tool includes built-in benchmarks for guest amenities and linen costs, which start at 4.5% of revenue. Comparing your local bids against these standards helps you sanity-check your assumptions and compare expected performance against typical hospitality ranges.


Simply purchase and download the financial model template, then access it instantly using Microsoft Excel or Google Sheets. No installation or technical expertise required-just open and start working.

Enter your business-specific numbers, including revenue projections, costs, and investment details. The pre-built formulas will automatically calculate financial insights, saving you time and effort.

Leverage the investor-ready format to confidently showcase your financial projections to banks, franchise representatives, or investors. Impress stakeholders with clear, data-driven insights and professional reports.

Leverage the investor-ready format to confidently present your projections to banks, franchise representatives, or investors.