
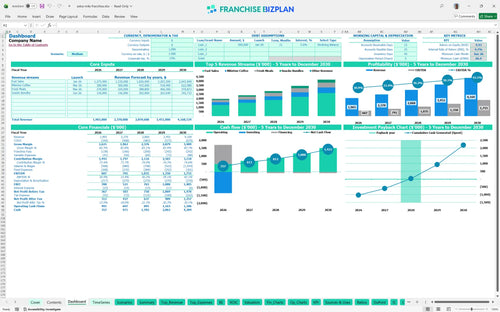
All-in-one Dashboard
Core inputs and core outputs


The franchise unit financial model template includes a complete set of pro forma statements, startup cost trackers, and ROI calculators tailored for high-traffic retail units.
Core inputs and core outputs
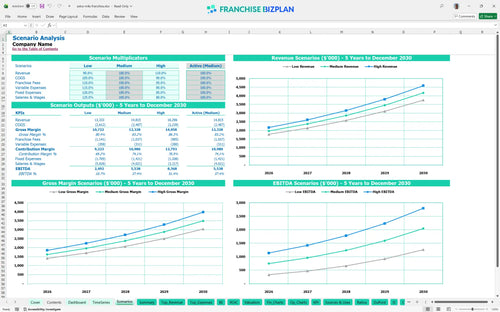
Three scenario analysis
Presentation ready
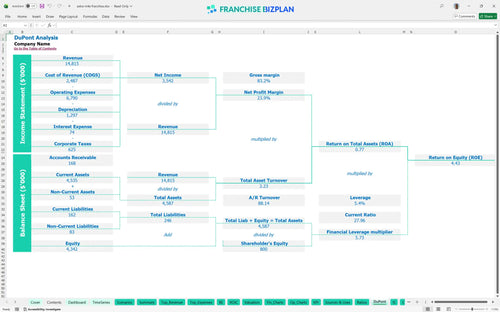
DuPont analysis
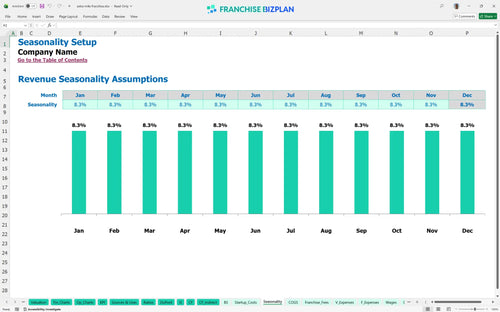
Researched revenue assumptions
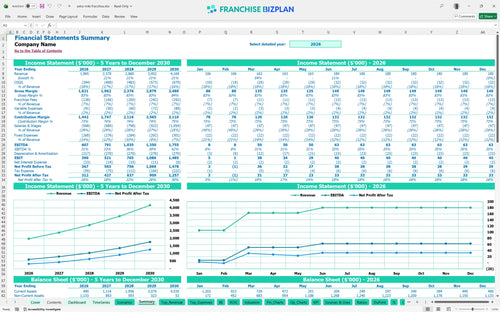
Lender-friendly financial outputs
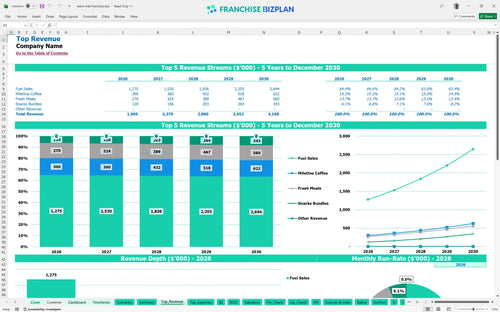
Revenue stream detailed view
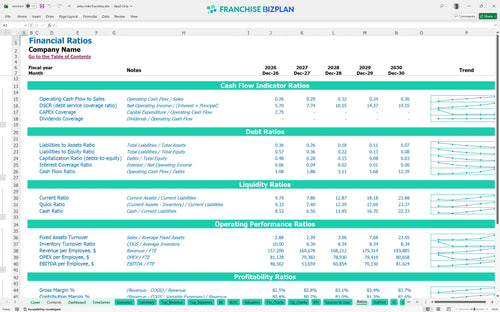
Performance metrics benchmark
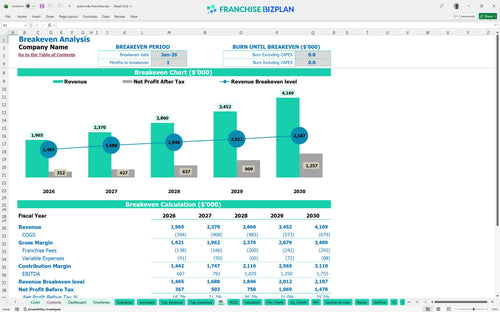
We built this franchise unit financial model using intensive research into high-traffic retail and fuel operations. Key assumptions for revenue streams like fuel sales and fresh meals, plus operational expenses and franchise royalty fees, are pre-populated and fully editable. With year one revenue projected at $1,965,000 and EBITDA at $607,000, this tool provides a data-driven foundation for your investment decision.
This unit hits profitability almost immediately, with a break-even date in January 2026, just one month after launch. By year three, EBITDA is expected to surpass $1 million as fresh meal and coffee programs mature. Profit isn't just what's left; it's what you protect.
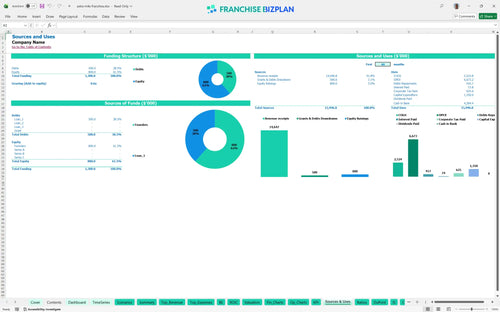
Launching this unit requires a total franchise investment of $1,350,000 in the US. This covers the $50,000 franchise fee, major CAPEX (capital expenditure) like fuel pumps, and the initial inventory needed to open the doors. Cash is king, but allocation is the kingdom.
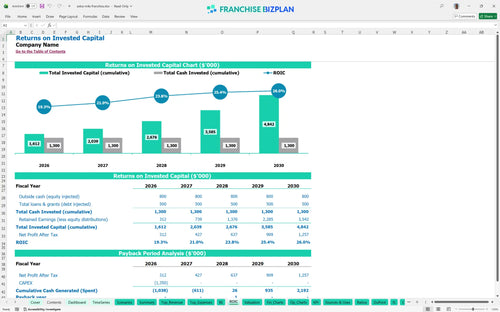
Investors can expect an Internal Rate of Return (IRR) of 4.69% and a Return on Equity (ROE) of 4.43%. The payback period is 3 years, which is standard for a high-CAPEX retail franchise unit. Returns take time, so patience is a line item.
The monthly break-even point is reached in the first month of trading, driven by high-volume fuel sales and immediate demand for convenience items. The 6% fuel margin and $15,000 rent are the primary drivers of this threshold. Break-even is the first real victory.
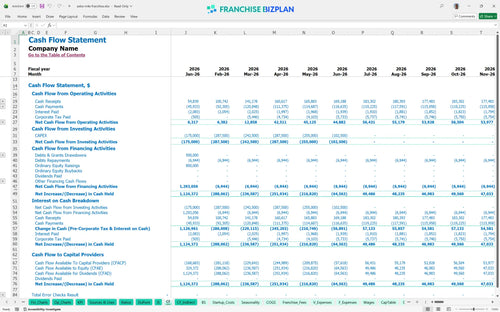
The lowest cash point is $66,000 in June 2026, following the final equipment and inventory outlays. You need enough runway to cover the $21,000 monthly fixed cost base during the initial six-month ramp-up. The lowest cash point is where most owners blink.
In a high-growth scenario, revenue climbs from $1.9 million to $4.1 million by year five, nearly tripling EBITDA. A low-growth case would likely see tighter margins if fuel product costs exceed 6% or if labor productivity lags. Scenarios are just maps for different weather.
Finance: update unit break-even and payback model by Friday.
This franchise financial model is built in Excel with fully editable assumptions, allowing you to stress-test your convenience store business plan under any market condition. You can adjust fuel margins, merchandise mix, and labor hours to see how local shifts impact your bottom line. It is a flexible franchise startup cost calculator that adapts as your site selection or lease terms change. Control your numbers or they will defintely control you.

Map your growth from a single unit to a multi-unit operation with detailed 5-year gas station profit projections. The model tracks revenue scaling from $1.96 million in year one to over $4.16 million by year five, accounting for ramp-up periods and maturing traffic patterns. It provides a clear cash flow statement to ensure you stay liquid during expansion. Five years is a lifetime in retail; plan for the shift.

Managing franchise royalty fees is critical for maintaining store-level EBITDA (earnings before interest, taxes, depreciation, and amortization). This tool calculates the 5% royalty and 2% marketing fund contributions automatically based on your gross sales forecasts. It ensures you understand the impact of these ongoing costs on your monthly net income. Royalties are a top-line tax that never sleeps.

Estimating profitability for a new convenience store location requires a deep dive into the $1.35 million initial investment. This model includes a break-even analysis that identifies the exact sales volume needed to cover your $15,000 monthly rent and $21,000 in monthly fixed operational expenses. Speed to break-even is the only metric that keeps you calm in month two.

This franchise investment analysis uses real-world benchmarks, such as 6% fuel product costs and 11.5% merchandise margins, to keep your projections realistic. You can compare your projected labor spend against industry standards for managers, cashiers, and stock clerks to ensure your staffing levels are optimized for throughput. Benchmarks are the guardrails that keep your ego in check.


Simply purchase and download the financial model template, then access it instantly using Microsoft Excel or Google Sheets. No installation or technical expertise required-just open and start working.

Enter your business-specific numbers, including revenue projections, costs, and investment details. The pre-built formulas will automatically calculate financial insights, saving you time and effort.

Leverage the investor-ready format to confidently showcase your financial projections to banks, franchise representatives, or investors. Impress stakeholders with clear, data-driven insights and professional reports.

Leverage the investor-ready format to confidently present your projections to banks, franchise representatives, or investors.