
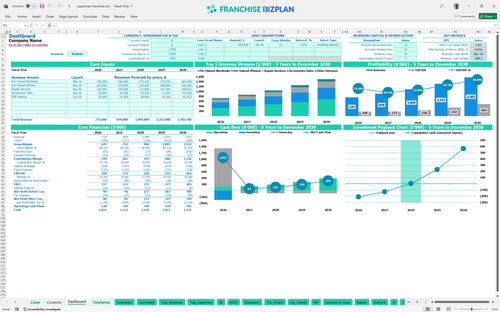
All-in-one Dashboard
Core inputs and core outputs


The franchise unit financial model template includes a comprehensive Excel model for franchise operational overhead, integrated cash flow statements, and detailed CAPEX schedules for tech retail equipment.
Core inputs and core outputs
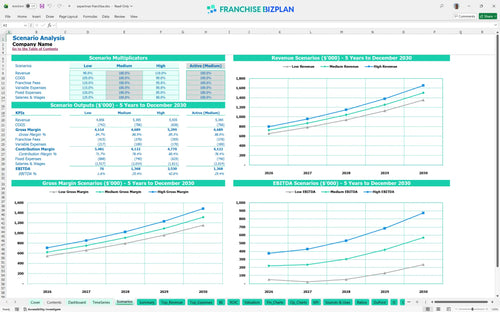
Three scenario analysis
Presentation ready
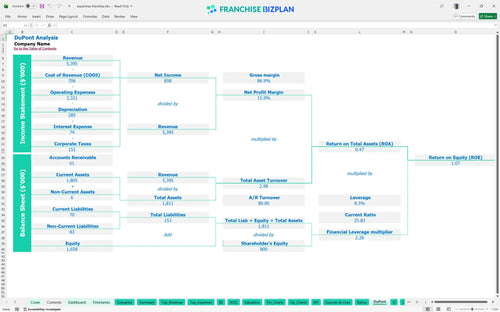
DuPont analysis
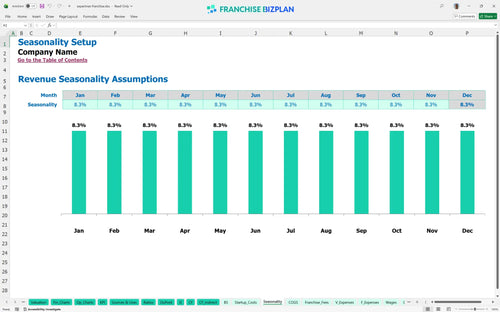
Researched revenue assumptions
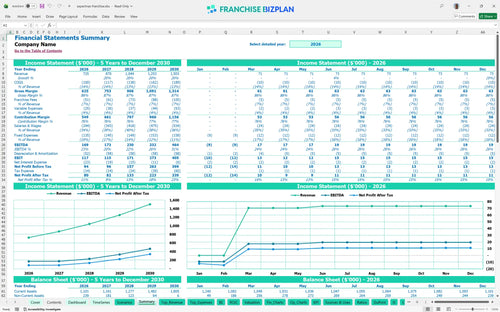
Lender-friendly financial outputs
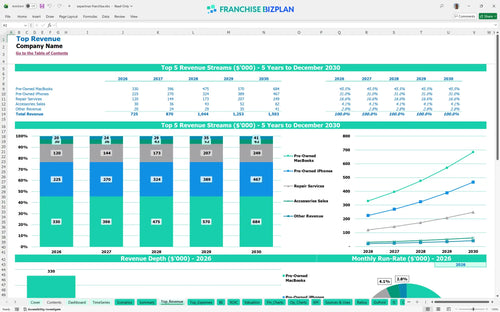
Revenue stream detailed view
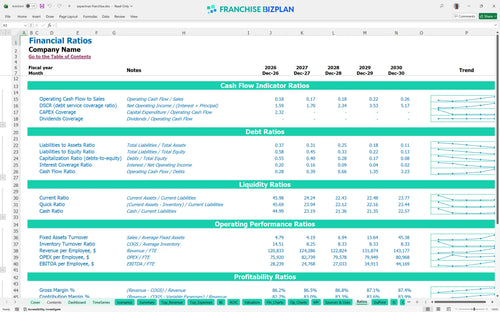
Performance metrics benchmark
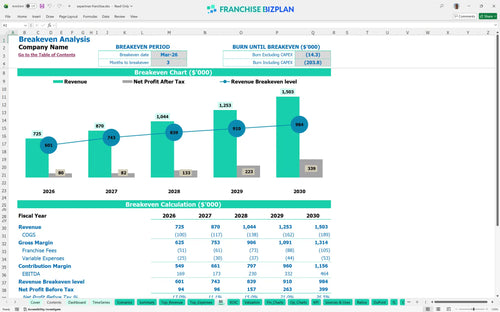
This tech retail unit reaches profitability in March 2026, just three months after the initial launch. Based on Year 1 revenue of $725,000 and EBITDA of $169,000, the model shows a fast ramp-up as you capture local repair demand and start selling certified pre-owned devices. Profitability is driven by high-margin services and efficient inventory turnover, which defintely helps offset the initial startup costs.
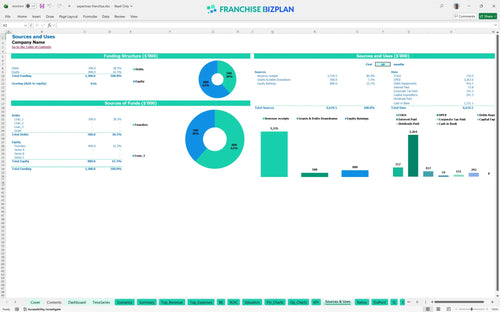
To launch this unit in the US, you will need an initial investment of roughly $291,500, which includes the franchise fee and essential store build-out. This capital is allocated across leasehold improvements, initial inventory of $60,000, and specialized repair tools. The model also accounts for a cash buffer to handle the first few months of trading before the unit hits its break-even point in month three.
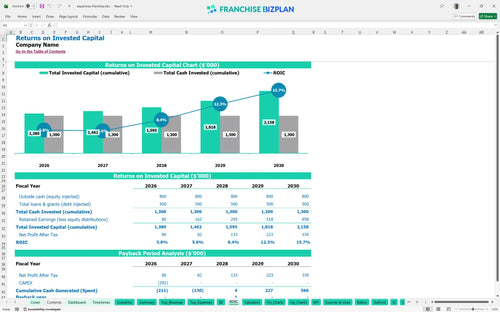
Investors can expect a 3-year payback period and an Internal Rate of Return (IRR) of 4.75% based on the current five-year growth plan. While the IRR is conservative, the Return on Equity (ROE) of 1.07 indicates that the business is generating solid value relative to the capital deployed. By year five, the unit is projected to generate $464,000 in annual EBITDA, significantly increasing the potential exit valuation.
The monthly break-even point occurs in the third month of operation, assuming you hit the projected first-year revenue target of $725,000. The primary drivers for reaching this point are the $8,000 monthly rent and the $182,000 annual payroll for the management and technician team. To reach break-even faster, focus on the $80,000 repair service stream, which carries higher margins than hardware sales.
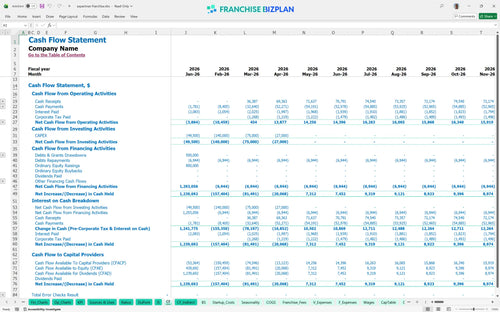
The lowest cash point is projected for April 2026 at $981,000, which includes the initial capital injection and early operating losses. You should maintain at least four months of operating runway to account for the ramp-up of B2B leasing, which begins in June 2026. Managing your initial inventory spend and phasing in your technician hires as volume grows will help protect your cash position during the first year.
Comparing Low, Medium, and High scenarios shows how a 10% change in MacBook sales impacts your year-1 EBITDA. In the High case, aggressive local marketing and B2B outreach can push revenue toward the $1.5 million mark by year five, significantly improving your ROI for a pre-owned tech retail location. The Low case highlights the importance of controlling fixed costs like rent and insurance if foot traffic is slower than expected.
This financial planning guide for new franchise owners provides the framework needed to validate your local market and adjust your electronics repair business financial projection. Use the model to stress-test your assumptions before signing a lease or committing to the franchise agreement. Calculating ROI for a pre-owned tech retail location requires precise data on your specific territory's demographics and competition.
Finance: update unit break-even and payback model by Friday.
This franchise financial model template is built in Excel with fully editable assumptions, allowing you to swap our researched data for your specific local market reality. You can adjust everything from technician wages to the price of a screen repair, and the pre-filled formulas will instantly update your five-year outlook. It is designed to be a flexible tool for a tech retail franchise business plan, making it easy to model different store sizes or labor structures without breaking the logic.

Success in electronics repair requires a long-term view of how hardware sales and service contracts scale over time. This model provides a detailed 5-year electronics repair business financial projection, showing revenue growing from $725,000 in year one to over $1.5 million by year five. By mapping out the long-term trajectory, you can plan for future technician hires and inventory expansion while tracking store-level EBITDA to ensure the unit remains a viable investment.

Operating within a brand system means managing specific financial obligations that impact your daily take-home pay. This model tracks the $49,500 initial fee and calculates the ongoing 6% royalty and 1% marketing fund contributions automatically based on your sales volume. By accounting for these franchise royalty fees upfront, you get a transparent view of your true store-level margin and can better manage your local operating overhead.

Our franchise startup cost calculator helps you estimate the total initial investment, which is approximately $291,500 for this concept. The model includes a break-even analysis for franchises, showing the exact revenue needed to cover your $8,000 monthly rent and fixed utilities. Understanding these numbers helps you set daily sales targets for your team and ensures you have enough working capital to reach the point where the business pays for itself.

This retail franchise unit profitability analysis incorporates industry-standard benchmarks to help you verify your operating assumptions. For example, inventory acquisition is modeled at roughly 11% of revenue, while refurbishment supplies sit at 2.8%. These built-in metrics allow you to compare your store's performance against typical tech retail standards, helping you identify if you are overspending on parts or if your labor costs are out of alignment with your sales volume.


Simply purchase and download the financial model template, then access it instantly using Microsoft Excel or Google Sheets. No installation or technical expertise required-just open and start working.

Enter your business-specific numbers, including revenue projections, costs, and investment details. The pre-built formulas will automatically calculate financial insights, saving you time and effort.

Leverage the investor-ready format to confidently showcase your financial projections to banks, franchise representatives, or investors. Impress stakeholders with clear, data-driven insights and professional reports.

Leverage the investor-ready format to confidently present your projections to banks, franchise representatives, or investors.