
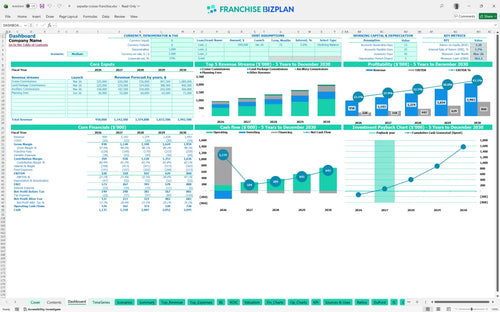
All-in-one Dashboard
Core inputs and core outputs


This Excel template for franchise unit financial forecasting includes a complete set of integrated financial statements, startup cost breakdowns, and customizable revenue drivers for a retail travel business.
Core inputs and core outputs
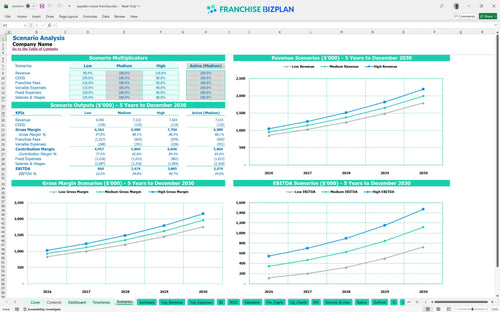
Three scenario analysis
Presentation ready
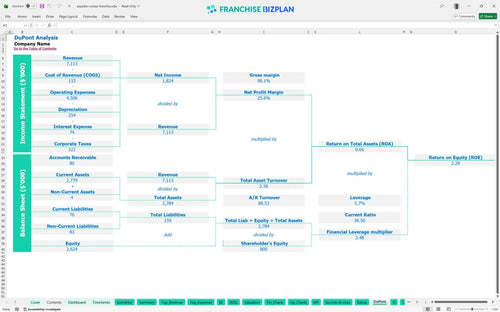
DuPont analysis
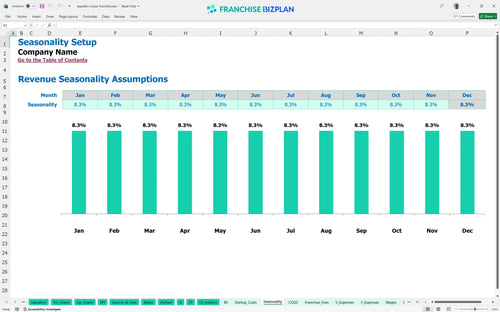
Researched revenue assumptions
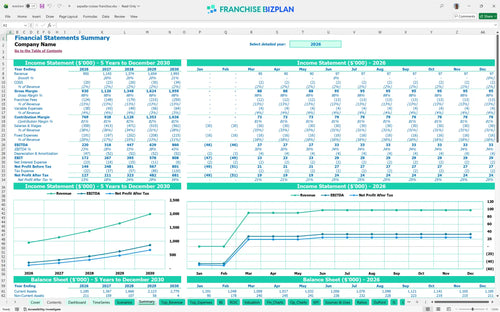
Lender-friendly financial outputs
Revenue stream detailed view
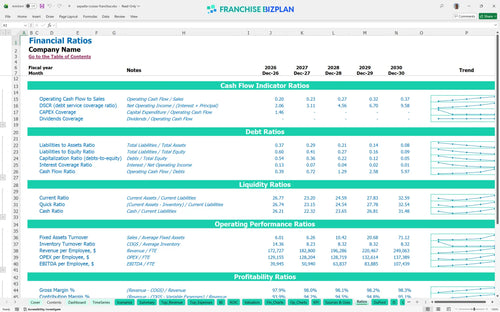
Performance metrics benchmark
This franchise unit financial model was built using detailed research into the travel agency sector to ensure your projections are grounded. We pre-populated the model with specific assumptions like a 9% royalty fee and a $49,000 initial franchise fee, alongside a year one EBITDA target of $220,000. These inputs are fully editable, so you can adjust the $950,000 starting revenue or the $10,000 monthly rent to fit your specific location. Honestly, having a researched starting point saves you dozens of hours in the planning phase.
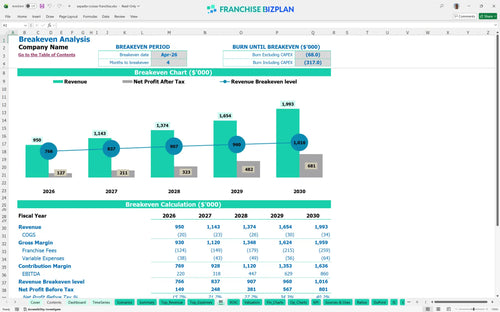
The unit hits profitability in its first year, generating $220,000 in EBITDA by the end of year one. With a break-even date of April 2026, the model shows a fast ramp-up period of only four months. Four months to break even is a fast start for any retail concept. We estimate net profit by subtracting 13% in franchise-related fees and your $16,700 in monthly fixed costs from your cruise and land package comissions.
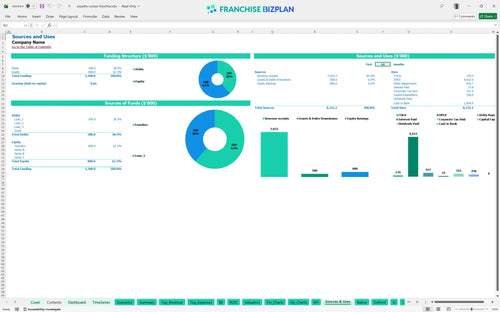
To launch this unit in the US, you will need approximately $258,000 in initial capital for physical assets and fees, plus a healthy cash buffer. This includes the $49,000 franchise fee and $85,000 for retail space improvements to meet brand standards. Fit-out costs are your biggest upfront hurdle before you even open the doors. The model also accounts for computer workstations and digital displays to create that premium VIP lounge feel.
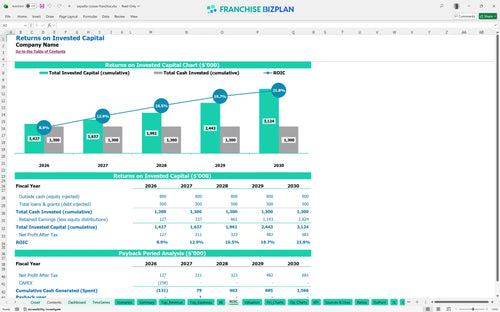
Investors can expect an Internal Rate of Return (IRR) of 7.7% and a Return on Equity (ROE) of 2.28 over the five-year period. The payback period is estimated at 2 years, which is quite efficient for a retail-based service model. A two-year payback is solid for retail, especially when you consider the scaling revenue that reaches $1.99 million by year five. These metrics assume you hit your cruise and land package targets as planned.
Your monthly break-even revenue is reached in April 2026, just four months after the January launch. The biggest driver affecting this is your fixed cost base, specifically the $10,000 monthly rent and the 13% combined royalty and marketing burden. Volume is the only way to outrun fixed rent in a high-visibility shopping center. If your cruise commissions dip below the $29,000 monthly average in year one, your break-even timeline will defintely slide.
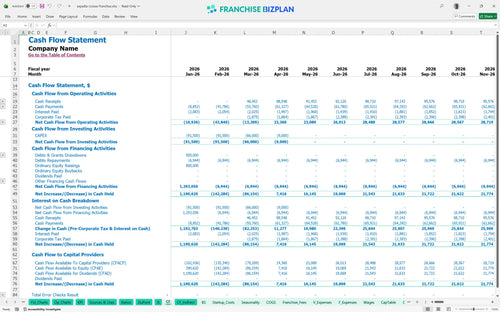
The lowest cash point occurs in March 2026, with a minimum cash balance of $962,000 after all startup costs and initial operating losses are paid. You need enough runway to cover the first four months of operations before the unit becomes self-sustaining. March 2026 is your tightest spot, so keeping a tight lid on office consumables and janitorial costs early on is smart. We recommend a cash buffer to handle any delays in commission payouts from travel suppliers.
The difference between the Low and High scenarios often comes down to your average ticket on luxury land packages and cruise upsells. In the High case, year five revenue can exceed $1.99 million, significantly boosting your 2.28 ROE. Execution in the lounge drives the high case, as immersive displays help close larger deals. If revenue stays at the year one level of $950,000 without growth, your payback period will extend well beyond the 2-year mark.
Finance: update unit break-even and payback model by Friday.
This franchise financial model template is built in Excel to give you total control over your unit-level planning. You can adjust pre-filled formulas and editable assumptions to match your specific territory, whether you are looking at a high-traffic retail spot or a smaller boutique setup. Every 1-point margin leak matters fast in a single-unit model, so having the ability to tweak your own numbers is vital.

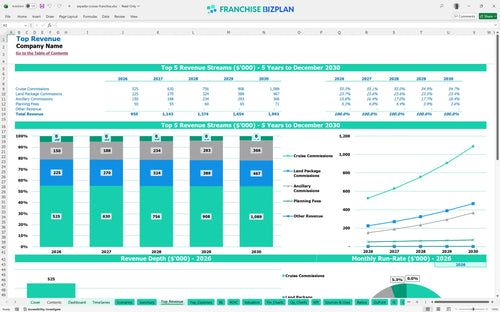
Mapping out the long-term health of your travel agency franchise business plan requires more than just a one-year view. This model provides a detailed 5-year outlook, showing revenue growing from $950,000 in year one to nearly $2 million by year five. Timing gaps between your initial opening costs and mature-unit performance can sink a store if you don't plan for them. Use this to see how your cash flow and balance sheet evolve as you scale.

Operating a franchise means managing specific financial obligations that independent shops don't have. This franchise unit profit and loss spreadsheet calculates your 9% royalty and 4% marketing fund contributions automatically based on your sales. Royalties are a top-line tax that never sleeps, so we make sure they are baked into your store-level EBITDA from day one. This helps you see the real economics after the franchisor takes their cut.

Knowing how to calculate startup costs for a travel agency franchise is the first step toward a successful launch. Our small business startup cost estimator totals your initial investment, including the $49,000 franchise fee and $85,000 in retail space improvements. Break-even depends less on headline sales and more on how fast you can cover your $10,000 monthly rent and fixed overhead. This analysis shows you exactly when the unit starts paying you back.

We have included industry-specific benchmarks to help you sanity-check your operating budget forecasting. From a $10,000 monthly rent to a $85,000 store manager salary, these numbers reflect the reality of running a luxury travel retail location. Benchmarks keep your assumptions grounded in reality so you don't over-promise on your return on investment analysis. It is much easier to manage a store when you know your labor and occupancy costs are in line with the chain.


Simply purchase and download the financial model template, then access it instantly using Microsoft Excel or Google Sheets. No installation or technical expertise required-just open and start working.

Enter your business-specific numbers, including revenue projections, costs, and investment details. The pre-built formulas will automatically calculate financial insights, saving you time and effort.

Leverage the investor-ready format to confidently showcase your financial projections to banks, franchise representatives, or investors. Impress stakeholders with clear, data-driven insights and professional reports.

Leverage the investor-ready format to confidently present your projections to banks, franchise representatives, or investors.