
All-in-one Dashboard
Core inputs and core outputs


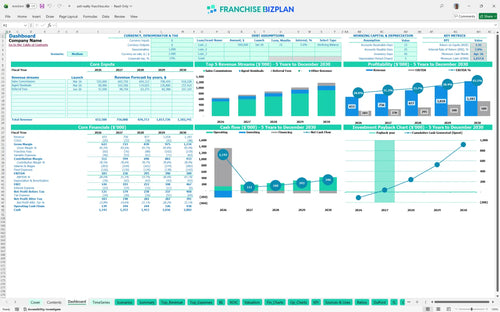
This comprehensive Excel tool provides a 5-year roadmap including startup costs, agent-driven revenue streams, and detailed cash flow analysis for a real estate brokerage unit.
Core inputs and core outputs
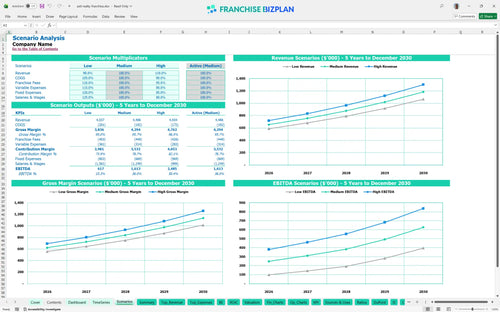
Three scenario analysis
Presentation ready
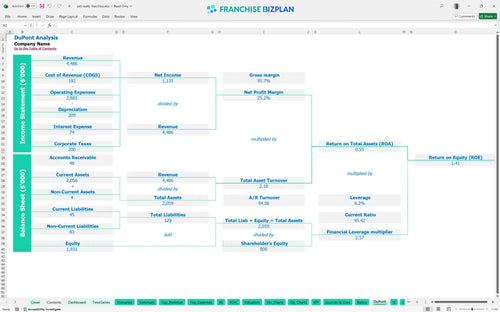
DuPont analysis
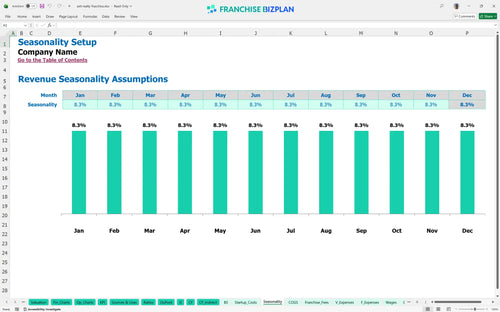
Researched revenue assumptions
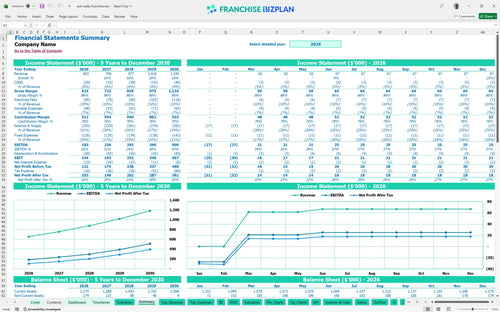
Lender-friendly financial outputs
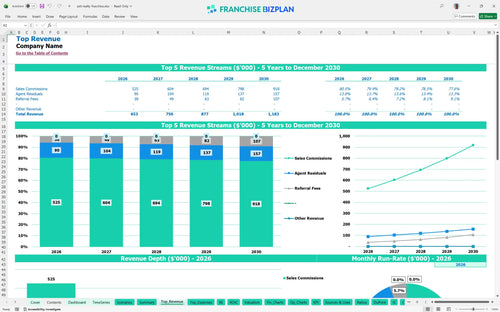
Revenue stream detailed view
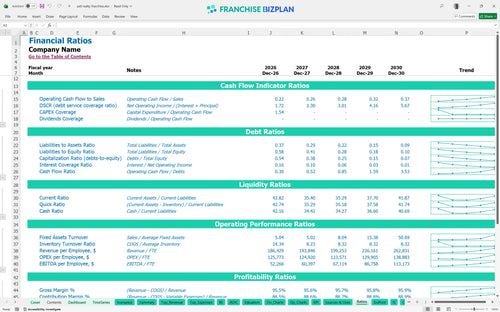
Performance metrics benchmark
We built this franchise unit financial model using our own research into the real estate brokerage sector and this specific brand's unique residual income formula. Key assumptions like the $25,000 franchise fee, 10% royalty, and $653,000 year-one revenue are pre-populated and fully editable to match your local market. This tool helps you visualize how the $183,000 year-one EBITDA scales as you recruit more agents and grow your commission base.
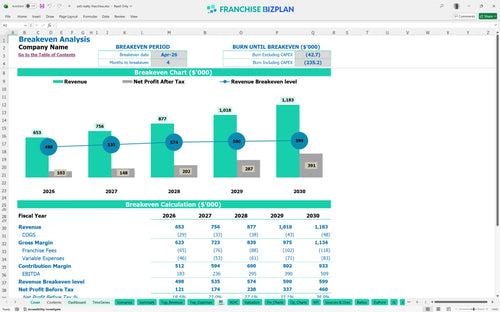
Based on the $653,000 year-one revenue target, this unit reaches profitability almost immediately, with a break-even date of April 2026. After accounting for the 10% royalty and fixed costs like the $70,000 managing broker salary, the model shows EBITDA growing from $183,000 in year one to over $509,000 by year five.
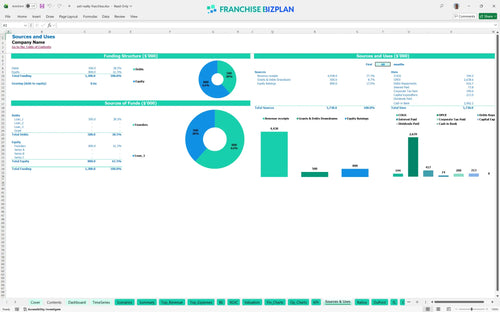
You will need approximately $213,000 in hard capital for the initial setup, plus a significant cash buffer for operations. The primary uses include $80,000 for leasehold improvements and $30,000 for smart signage technology, ensuring your boutique storefront meets brand standards from day one.
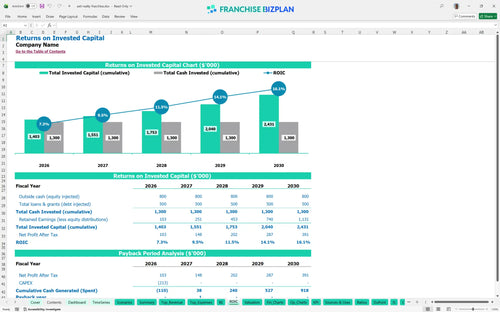
The investment shows a 7.04% internal rate of return (IRR) with a remarkably fast 2-year payback period. Honestly, while the IRR might look modest compared to high-risk ventures, the 1.41 return on equity (ROE) and steady EBITDA growth provide a stable path for multi-unit expansion.
The unit hits its monthly break-even point in April 2026, just four months after launching. The biggest driver for this is agent productivity; since rent is fixed at $7,500, hitting your sales commission targets early is the fastest way to cover your overhead and the 10% royalty burden.
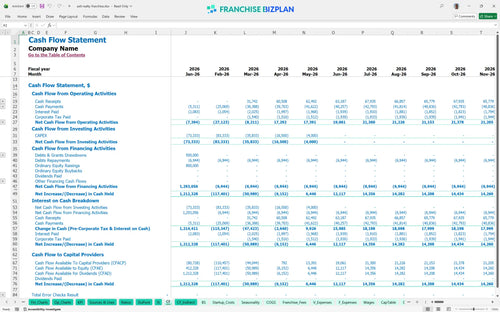
The lowest cash point occurs in April 2026, coinciding with the break-even month, where the model shows a minimum cash requirement of $1,038,000. This suggests you need a deep reserve to handle the ramp-up and initial $213,000 build-out costs before the commission checks start flowing consistently.
A 10% drop in sales commissions can push your payback period past year three and significantly thin your year-one EBITDA margin. Conversely, hitting the High Case through better agent retention and higher referral fees can accelerate your $509,000 year-five profit target by twelve months.
Finance: update unit break-even and payback model by Friday.
This franchise unit financial model is built in Excel, allowing you to modify every variable to match your specific territory and market conditions. It features pre-filled formulas and editable assumptions for agent counts and commission splits, making it easy to adapt the real estate franchise business plan to your local reality. Every 1-point margin leak matters fast in a single-unit model, so we defintely made it easy to track every dollar.

Plan for long-term growth with detailed 5-year franchise unit financial projections that track your path from a startup office to a mature brokerage. The model scales revenue from $653,000 in year one to over $1.18 million by year five, providing a clear view of EBITDA and cash flow at every stage. Long-term value is built on the spread between commission splits and your fixed office overhead.

The model accurately captures your ongoing financial obligations, including the 10% royalty fee and the initial $25,000 franchise fee. By mapping these costs against your sales commissions and referral fees, you can see the true store-level margin after the franchisor takes their cut. Royalties are a top-line tax that requires high agent productivity to offset effectively.

Use the franchise startup costs template to plan your initial $213,000 capital investment, covering everything from leasehold improvements to smart signage technology. The break-even analysis identifies the exact month your commissions cover your $7,500 monthly rent and payroll. Speed to break-even is the best hedge against early-stage capital exhaustion in a new real estate office.

We have integrated industry-specific benchmarks to help you sanity-check your real estate franchise profitability analysis against typical market ranges. From the $70,000 managing broker salary to the 4.5% total cost of goods (COGS) for dues and documents, these metrics ensure your plan is grounded in reality. Benchmarking ensures your rent-to-revenue ratio doesn't eat your bottom line before you scale.


Simply purchase and download the financial model template, then access it instantly using Microsoft Excel or Google Sheets. No installation or technical expertise required-just open and start working.

Enter your business-specific numbers, including revenue projections, costs, and investment details. The pre-built formulas will automatically calculate financial insights, saving you time and effort.

Leverage the investor-ready format to confidently showcase your financial projections to banks, franchise representatives, or investors. Impress stakeholders with clear, data-driven insights and professional reports.

Leverage the investor-ready format to confidently present your projections to banks, franchise representatives, or investors.