
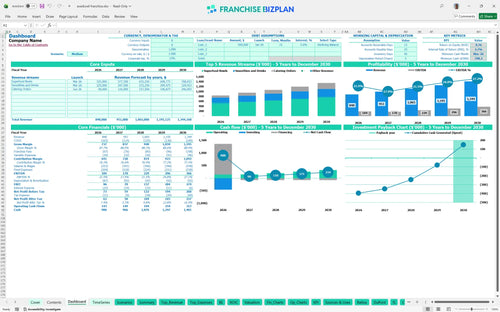
All-in-one Dashboard
Core inputs and core outputs


This franchise unit financial model template provides a comprehensive toolkit for analyzing startup costs, operational cash flow, and five-year profitability for a health-focused retail location.
Core inputs and core outputs
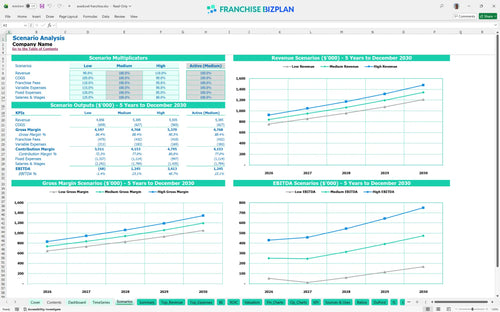
Three scenario analysis
Presentation ready
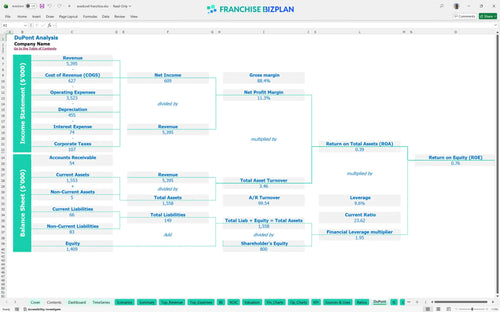
DuPont analysis
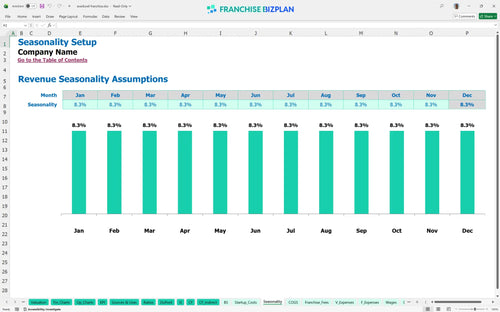
Researched revenue assumptions
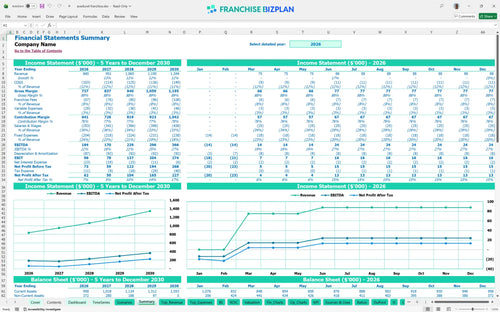
Lender-friendly financial outputs
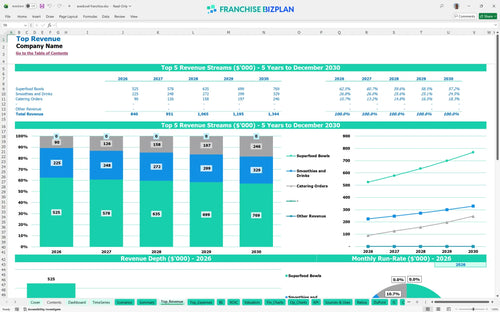
Revenue stream detailed view
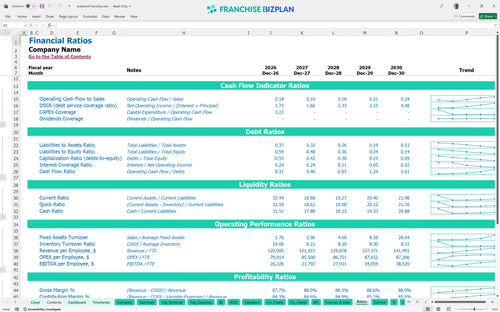
Performance metrics benchmark
We built this franchise unit financial model using our own research to support your restaurant franchise business plan. Key assumptions, including the $840,000 year-one revenue and the operational cost breakdown for health food franchise, are pre-populated with researched data specific to Everbowl Franchise franchise unit and are fully editable. This setup allows you to test different staffing levels, like the 3.5 FTE crew members, against your local market reality.
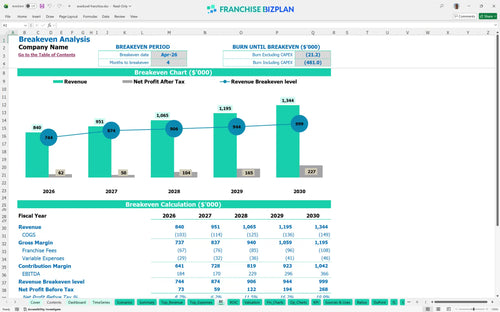
The model shows this location hits profitability in Year 1, specifically reaching a break-even date by Apr-26. By learning how to analyze franchise profitability metrics, you can see that the $184,000 Year 1 EBITDA provides a solid foundation even after paying for food ingredients and royalties. Managing your food costs, which start at 10.5%, is the key to keeping this trajectory on track.
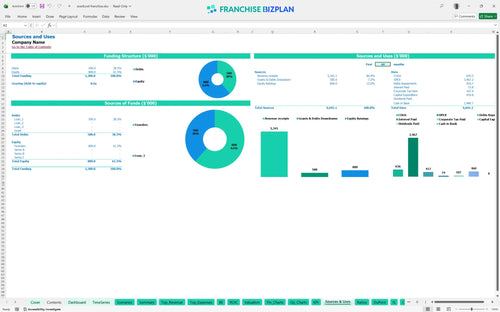
Starting this unit requires an initial investment of roughly $459,750. This capital expenditure budgeting covers the $39,750 franchise fee and $200,000 for leasehold improvements. Creating a budget for a new franchise location like this ensures you have enough liquidity to reach the $798,000 minimum cash point safely without running out of steam during the build-out phase.
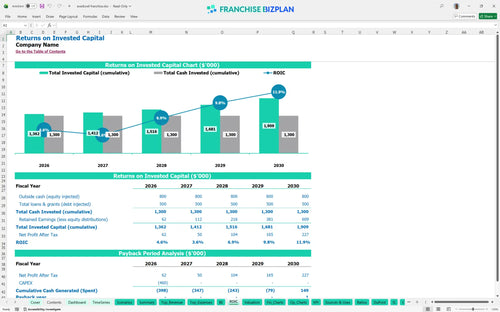
The retail franchise investment analysis indicates a 5-year payback period and an IRR of 2.74%. While estimating ROI for a new retail franchise unit, we found a return on equity of 0.76. These numbers assume you hit the Year 5 revenue target of $1,344,000 while keeping variable costs like delivery commissions under control. It is a steady build, but the cash flow becomes significant as the unit matures.
You reach the break-even point in month 4, which is quite fast for a retail build-out. The franchise unit break-even analysis calculator shows that your $12,000 monthly rent is the biggest fixed hurdle. Your operating expense forecast must prioritize high-traffic periods to cover these occupancy costs and the 30% plus labor burden. If you can move more bowls during the lunch rush, you hit your nut much faster every month.
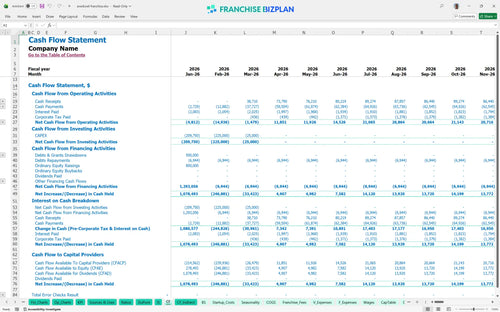
The financial forecasting for small business franchise identifies Mar-26 as your lowest cash point at $798,000. You defintely need to secure your funding before the Jan-26 leasehold work begins to avoid a liquidity crunch. Maintaining a buffer is smart because construction delays in prime areas can eat through working capital fast, and you want to ensure you can still pay your store manager during the ramp-up.
Our best financial model for quick service restaurant compares different scenarios to see how Year 1 margins shift. In the high-growth case, revenue climbs toward $1.34M by Year 5, significantly improving the 2.74% IRR. The low case warns that slow adoption in the first 6 months could push the 5-year payback even further out, so local marketing is non-negotiable. Success depends on how well you execute the 'fast-lane' digital ordering to keep throughput high.
Finance: update unit break-even and payback model by Friday.
This franchise financial model template is a fully customizable Excel tool designed for preparing financial statements for franchise funding. You can easily tweak the pre-filled formulas and assumptions to match your specific territory, whether you are looking at a single unit or a small cluster. The model allows you to adjust everything from local labor rates to specific rent escalations so your projections reflect the reality of your chosen market. Every cell is open, meaning you can adapt the logic to fit unique local demand or specific landlord requirements without breaking the core structure.

Our Excel template for franchise financial projections delivers a clear look at your next five years of operation. It tracks the growth from $840,000 in Year 1 to over $1.3M by Year 5, providing a clear franchise profit and loss template that helps you see long-term cash flow and balance sheet health. This long-range view is essential for understanding how the unit matures after the initial ramp-up phase. Plus, it helps you plan for future equipment replacements or potential renovations required by brand standards as the store ages.

The model handles the royalty fee structure and marketing fund contributions automatically based on your gross sales. This franchise disclosure document analysis tool ensures you account for the 6% royalty and 2% brand fund so you know exactly what stays in your pocket after the franchisor gets paid. Honestly, these off-the-top costs are the biggest difference between an independent shop and a franchise, so we make them impossible to miss. Tracking these obligations monthly ensures you never have a surprise bill from corporate at the end of the quarter.

Using this franchise startup cost calculator, you can map out the $459,750 needed for the initial launch. It includes a section on how to calculate startup costs for a food franchise, covering everything from the $200,000 leasehold improvements to the $25,000 contingency fund. Knowing your total out-of-pocket cost before you sign a lease is the best way to avoid running out of cash mid-construction. The break-even analysis then shows you exactly what daily sales volume you need to hit to start covering your monthly overhead.

We include unit economics benchmarks so you can compare your $12,000 monthly rent and labor costs against industry standards. This helps you see if your projected margins are realistic or if you need to tighten up the kitchen prep schedule to stay competitive. If your food costs are running higher than the 10.5% benchmark in the model, you know exactly where to start looking for waste. Using these standards helps you manage the store by the numbers rather than by feel.


Simply purchase and download the financial model template, then access it instantly using Microsoft Excel or Google Sheets. No installation or technical expertise required-just open and start working.

Enter your business-specific numbers, including revenue projections, costs, and investment details. The pre-built formulas will automatically calculate financial insights, saving you time and effort.

Leverage the investor-ready format to confidently showcase your financial projections to banks, franchise representatives, or investors. Impress stakeholders with clear, data-driven insights and professional reports.

Leverage the investor-ready format to confidently present your projections to banks, franchise representatives, or investors.