
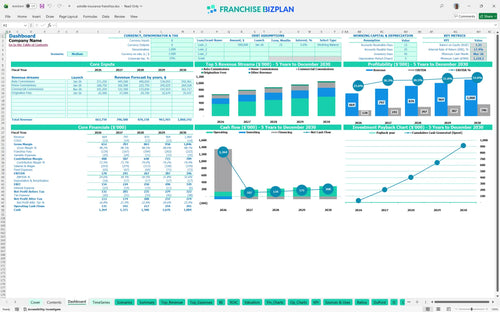
All-in-one Dashboard
Core inputs and core outputs


This franchise financial projection spreadsheet provides a comprehensive toolkit for estimating revenue for independent insurance agencies while managing brand-specific fees and retail operating costs.
Core inputs and core outputs
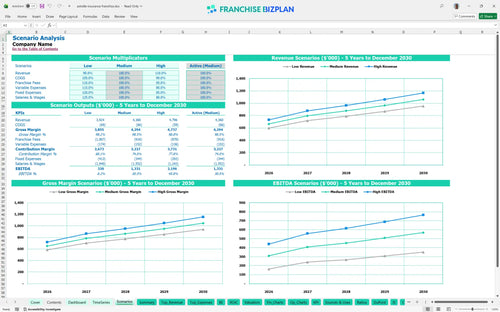
Three scenario analysis
Presentation ready
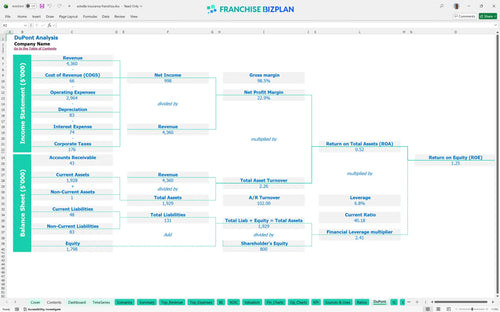
DuPont analysis
Researched revenue assumptions
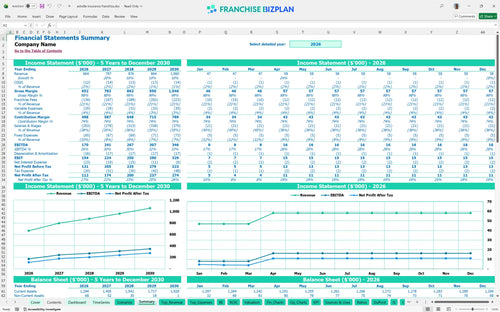
Lender-friendly financial outputs
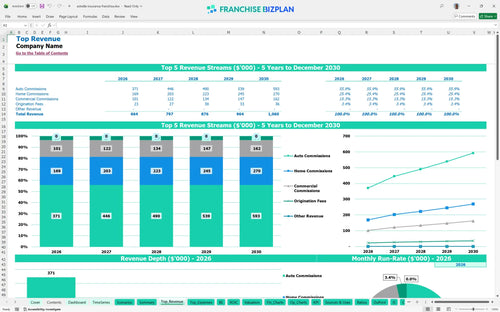
Revenue stream detailed view
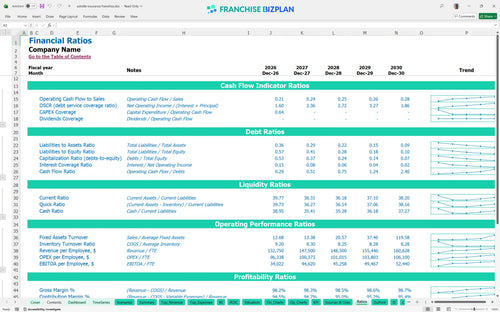
Performance metrics benchmark
We developed this franchise unit financial model through rigorous research into retail insurance economics and commission structures. The model comes pre-populated with data for a standard unit, including a $170,000 Year 1 EBITDA and specific commission streams for auto and home lines, all of which you can edit to reflect your local demand.
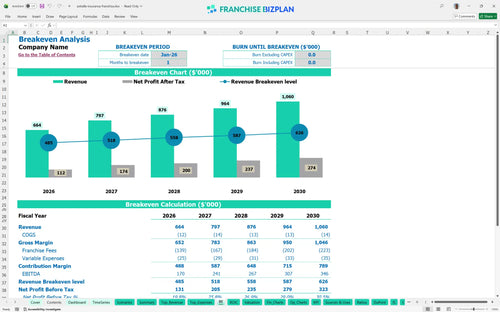
Based on the insurance agency profitability analysis, this unit becomes profitable almost immediately with a break-even date of January 2026. After covering 21% in brand fees and $174,000 in total Year 1 wages, the model shows a strong EBITDA trajectory starting at $170,000 and growing to $346,000 by Year 5.
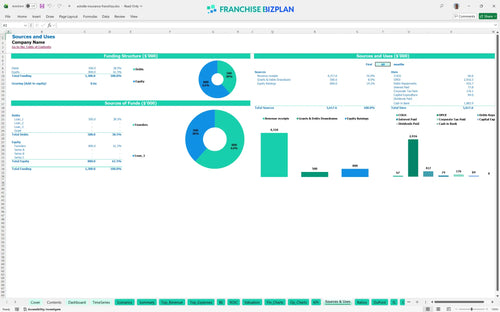
To launch this unit, you need approximately $84,000 in CAPEX plus an initial cash buffer, as shown in the small business insurance agency startup spreadsheet. This includes the $25,000 franchise fee, $20,000 for leasehold improvements, and $12,000 for computer systems to handle multi-carrier quoting.
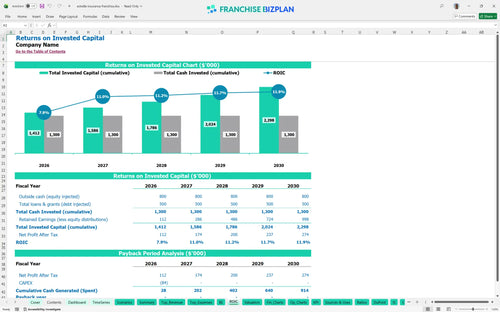
The ROI analysis for this unit indicates an Internal Rate of Return (IRR) of 17.41% and a Return on Equity (ROE) of 1.25. While the unit generates consistent cash flow, the years to payback extend after year 5 due to the initial investment and the timing of recurring commission income for insurance franchises.
The break-even point calculation shows the unit reaches sustainability in Month 1, provided you hit the Year 1 revenue target of $664,000. Your ability to cover the $3,800 monthly rent and fixed utilities depends defintely on maintaining high traffic and efficient policy processing from the start.
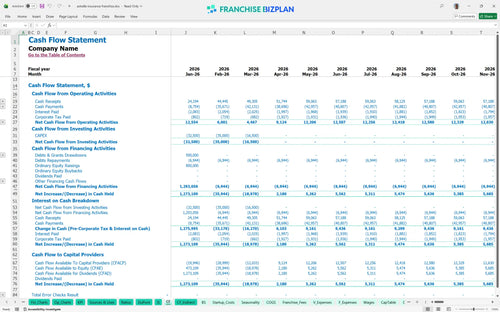
The lowest cash point occurs in March 2026 at $1,218,000, which includes your initial funding and early operating results. You need to manage your cash flow carefully during the first quarter to ensure you can cover the ramp-up of commercial commissions that begin in April 2026.
Financial forecasting for new insurance franchise units shows that a 10% revenue drop can tighten margins significantly given the 21% royalty and marketing burden. Conversely, a high-performance scenario driven by strong local referral partnerships can accelerate the payback period and boost the Year 5 net margin.
This insurance franchise financial model is fully customizable in Excel, allowing you to adjust commission splits and bilingual staffing levels to match your specific territory. The pre-filled formulas and editable assumptions simplify the process of adapting the model to your local market conditions and retail storefront overhead.

Plan your agency's trajectory with detailed 5-year projections that account for compounding renewals and new policy growth. This insurance agency business plan template provides a clear view of how revenue forecasting for auto, home, and commercial lines translates into long-term cash flow and sustainability.

The model accurately captures ongoing franchise royalty fees and marketing fund contributions to show you the true net income after brand obligations. With a 14% royalty and 7% marketing fee, understanding these recurring costs is vital for maintaining a healthy operating expense budget in a retail environment.

Use the franchise startup cost calculator to map out your total entry price, from the $25,000 initial fee to leasehold improvements and signage. This section helps you determine the exact break-even point calculation by comparing your total startup investment against monthly fixed and variable costs.

This pro forma financial model for retail insurance franchise includes built-in industry benchmarks to help you sanity-check your rent and labor projections. By comparing your $3,800 monthly rent and $154,000 Year 1 base wages against typical ranges, you can ensure your unit economics remain competitive.


Simply purchase and download the financial model template, then access it instantly using Microsoft Excel or Google Sheets. No installation or technical expertise required-just open and start working.

Enter your business-specific numbers, including revenue projections, costs, and investment details. The pre-built formulas will automatically calculate financial insights, saving you time and effort.

Leverage the investor-ready format to confidently showcase your financial projections to banks, franchise representatives, or investors. Impress stakeholders with clear, data-driven insights and professional reports.

Leverage the investor-ready format to confidently present your projections to banks, franchise representatives, or investors.