
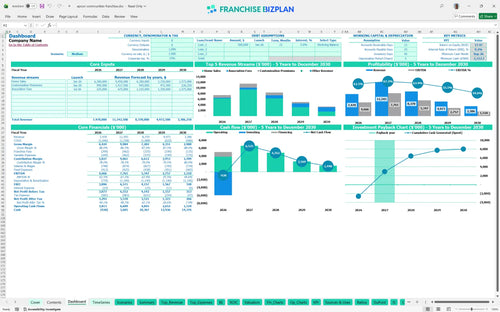
All-in-one Dashboard
Core inputs and core outputs


The franchise unit financial model template provides a comprehensive Excel-based framework for projecting development costs, home sale revenues, and multi-year operational cash flows. This tool is the bridge between a blueprint and a bank loan.
Core inputs and core outputs
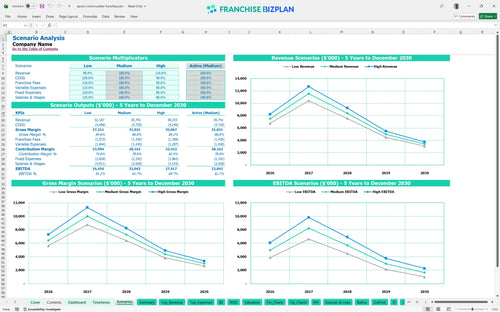
Three scenario analysis
Presentation ready
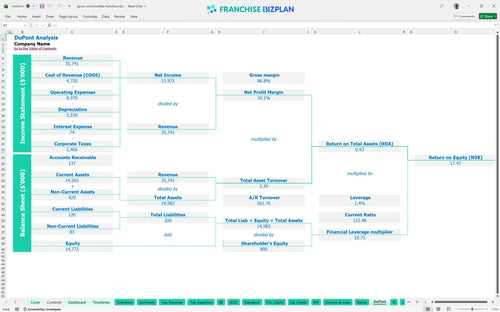
DuPont analysis
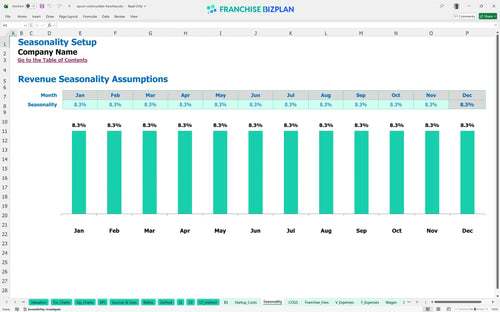
Researched revenue assumptions
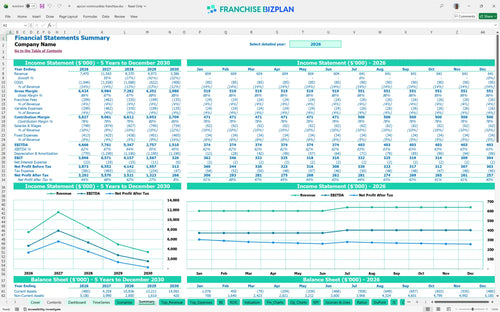
Lender-friendly financial outputs
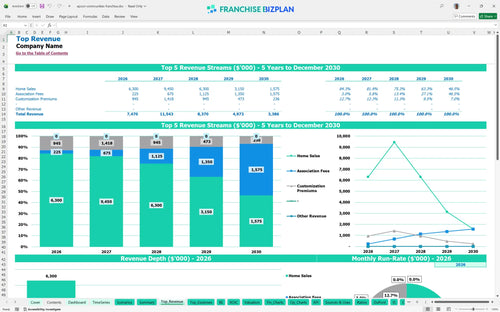
Revenue stream detailed view
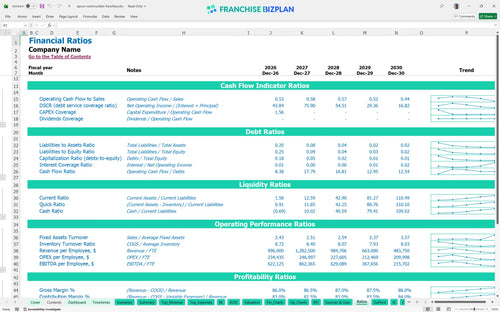
Performance metrics benchmark
We built this franchise unit financial model using our own research into how to project revenue for home construction franchise units. Key assumptions like the $4.2 million in year-one home sales and the 2% royalty fee are pre-populated and fully editable. The model shows strong early performance with an EBITDA of $4,666,000 in the first year, driven by high-velocity sales and customization premiums.
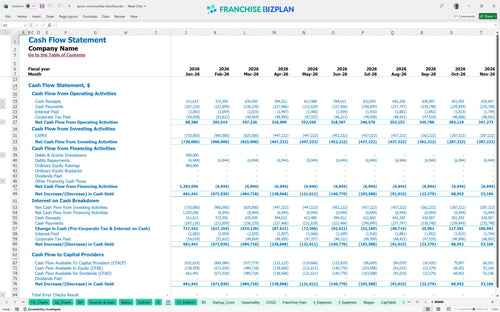
Profitability arrives almost immediately in January 2026 due to the high-ticket nature of residential sales and pre-sale deposits. After accounting for construction costs, 2% royalties, and $15,000 monthly sales center rent, the unit maintains a strong net margin through the peak development years. Profit follows the pace of your construction schedule.
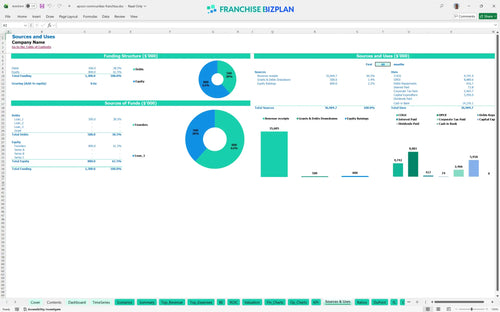
Launching this franchise unit requires a heavy upfront investment, primarily for land and site development. You will need approximately $5.95 million to cover the $1.8 million land acquisition, $2 million in residential construction, and the $50,000 franchise fee. Capital is the fuel that gets your clubhouse built.
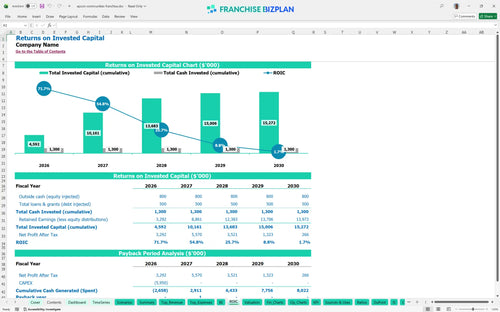
Investors can expect an Internal Rate of Return (IRR) of 9.21% and a Return on Equity (ROE) of 17.47%. The payback period is remarkably short at 2 years, as the high average ticket of luxury homes quickly offsets the initial land and construction costs. A two-year payback is the gold standard for luxury development.
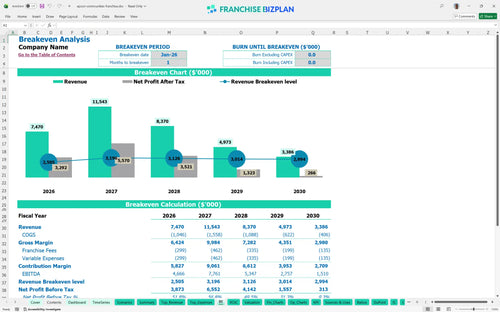
The monthly break-even point is reached in the very first month of operations, January 2026. This is possible because the model assumes significant revenue from home sales and customization premiums right at launch. Volume is the only lever that truly moves the needle.
Estimating operational costs for master-planned communities requires a deep look at the lowest cash point, which occurs in September 2026 at -$1,113,000. You need to ensure you have a sufficient credit line or cash buffer to handle the gap between clubhouse construction and final residential sales. Cash is king when the clubhouse is halfway done.
Our financial forecasting for senior living franchise units compares different market conditions. In a High scenario, increasing home sales by 10% significantly boosts the 9.21% IRR, while a Low scenario with higher construction costs could push the payback period beyond 3 years. The model shows that even a small 1-point margin leak in materials can defintely impact year-1 EBITDA. Scenarios prepare you for the 'what-ifs' of the housing market.
This franchise financial model is a fully customizable Excel tool designed for the complexities of residential development. You can adjust pre-filled formulas and editable assumptions to match your specific territory, whether you are projecting home sales or association fee recurring revenue. Every formula is open for your local market adjustments. It allows you to swap out local construction costs or land acquisition prices to see how they impact your bottom line.

Mapping out a 5-year trajectory is critical for a real estate development financial template. This model tracks revenue from an initial $7.47 million in year one, peaking at $11.54 million in year two, before tapering as the community reaches capacity. Five years of data turns a guess into a strategy. It provides a clear view of cash flow and profit margins, ensuring you can manage the transition from high-velocity home sales to long-term association management.

The model captures specific financial obligations like the $50,000 initial franchise fee and ongoing 2% royalty payments. By baking these into your pro forma financial statements, you see the true unit economics after the brand takes its cut. Royalties are a top-line reality you can't ignore. We also include the 2% marketing fund contribution to ensure your local demand generation stays aligned with brand standards without surprising your cash flow.

Estimating how to calculate startup costs for a real estate franchise requires looking at land, site prep, and construction. With a total residential construction budget of $2 million and land acquisition at $1.8 million, the upfront load is significant. Knowing your break-even date changes how you spend on day one. This model identifies the exact sales volume needed to cover these fixed costs, showing a break-even point as early as January 2026 if the sales velocity hits the targets.

This 55+ active adult community franchise profitability analysis uses built-in benchmarks to keep your projections grounded. For instance, we factor in construction costs starting at 12% of revenue and sales commissions at 3%. Benchmarks prevent you from flying blind in a new territory. These guardrails help you sanity-check your local vendor quotes against industry norms for luxury residential development, ensuring your gross margin stays within a healthy range.


Simply purchase and download the financial model template, then access it instantly using Microsoft Excel or Google Sheets. No installation or technical expertise required-just open and start working.

Enter your business-specific numbers, including revenue projections, costs, and investment details. The pre-built formulas will automatically calculate financial insights, saving you time and effort.

Leverage the investor-ready format to confidently showcase your financial projections to banks, franchise representatives, or investors. Impress stakeholders with clear, data-driven insights and professional reports.

Leverage the investor-ready format to confidently present your projections to banks, franchise representatives, or investors.