


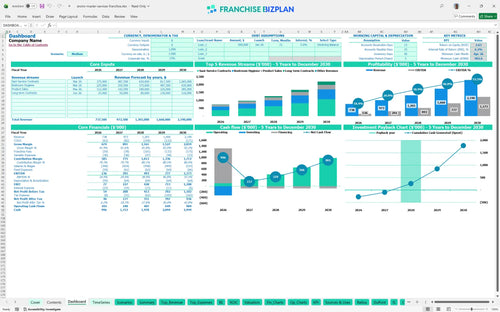
All-in-one Dashboard
Core inputs and core outputs



This franchise unit financial model template provides a complete 5-year roadmap covering startup costs, recurring revenue streams, and detailed EBITDA projections for a sanitation service territory.
Core inputs and core outputs
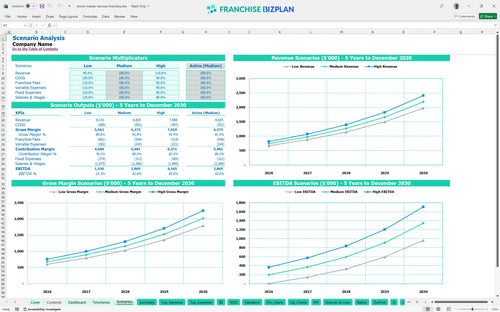
Three scenario analysis
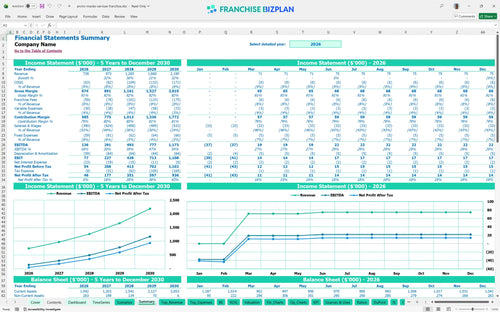
Presentation ready
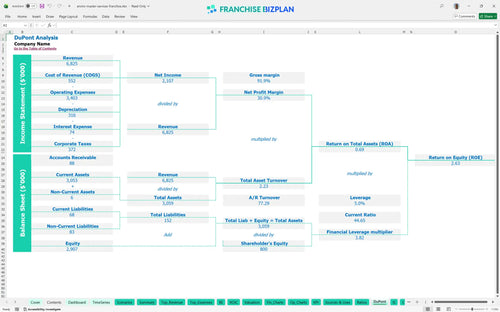
DuPont analysis
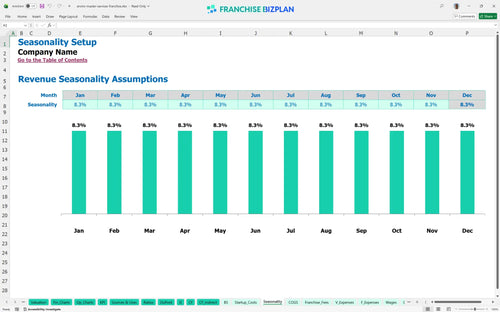
Researched revenue assumptions
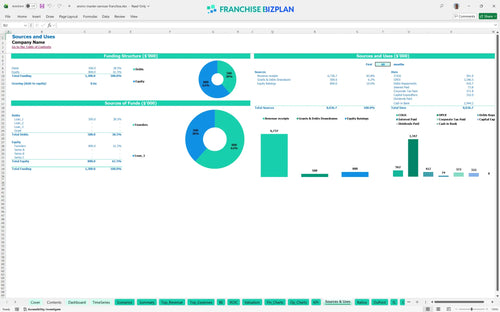
Lender-friendly financial outputs
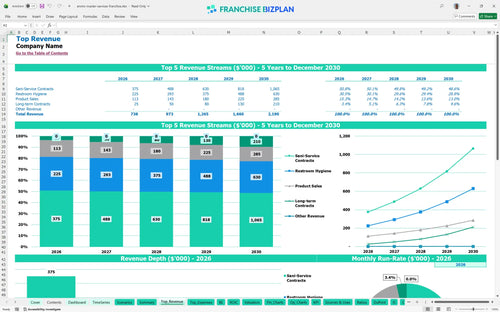
Revenue stream detailed view
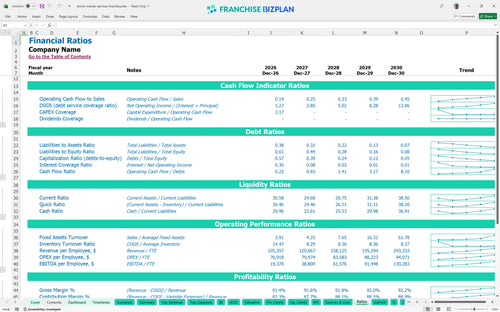
Performance metrics benchmark
We developed this financial model for an Enviro-Master Services Franchise unit based on detailed industry research into B2B sanitation and hygiene services. The model comes pre-populated with realistic revenue streams like Sani-Service contracts starting at $250,000 and Year 1 EBITDA of $136,000. You can easily edit the $322,000 in startup CAPEX or the 6% royalty assumptions to match your specific territory's needs.
This franchise unit is projected to reach profitability in its first year, specifically hitting a positive EBITDA of $136,000 by the end of Year 1. The model accounts for all recurring costs, including the 6% royalty and 2% marketing fees, showing a steady climb to $1.17 million in annual EBITDA by Year 5. Still, your speed to profit depends on how fast you can sign up high-margin Sani-Service contracts.
To launch this unit in the US, you will need approximately $322,000 in initial capital for equipment and fees, plus a working capital buffer. The largest outlays are the $120,000 for service vehicles and the $60,000 initial franchise fee. This investment covers everything from pressure washers to office fit-outs and initial technician certification to ensure you meet brand standards from day one.
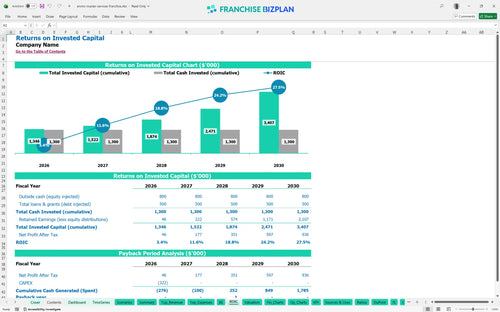
Investors can expect an Internal Rate of Return (IRR) of 6.15% and a Return on Equity (ROE) of 2.63 based on the five-year forecast. The payback period is estimated at 3 years, which is a solid result for a service-based business with high recurring revenue. Here's the quick math: with revenue jumping from $738k to $2.19M, the equity value of the business scales significantly by the end of the term.
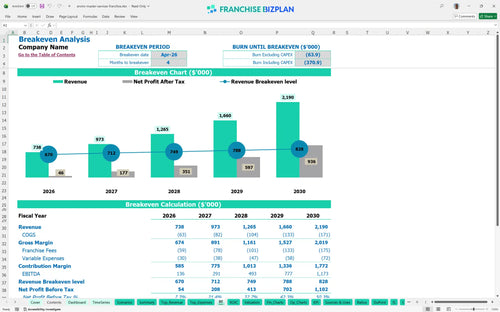
The monthly break-even point is reached in April 2026, just 4 months after launching the core service lines. The primary driver for hitting this goal is the volume of recurring Sani-Service and restroom hygiene contracts, which provide the predictable cash flow needed to cover the $2,800 monthly warehouse rent and $75,000 operations manager salary. Speeding up the sales cycle for long-term contracts is the fastest way to stabilize the unit.
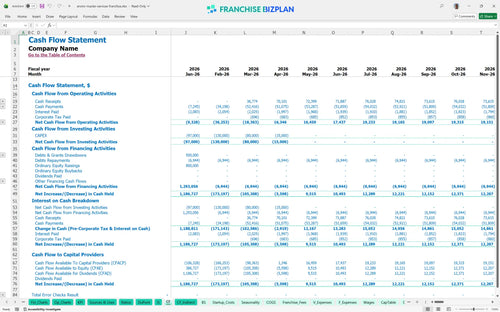
The lowest cash point for the unit is $903,000 in April 2026, which suggests a conservative capitalization strategy is required to handle the ramp-up phase. You should maintain a healthy runway to cover the initial months where payroll for five technicians and a sales rep precedes the full collection of service fees. Managing accounts receivable is vital to ensure the cash buffer remains intact during the first year of growth.
In a high-growth scenario, reaching $2.19 million in revenue by Year 5 is achievable if the sales representative hits the projected FTE targets and captures large property management accounts. A low-revenue scenario would likely extend the 3-year payback period and tighten the Year 1 EBITDA margin of 18%. The model allows you to toggle these variables to see how a 10% shift in fuel costs or labor productivity impacts your bottom line.
This franchise financial model template is built in Excel for total flexibility, allowing you to swap out every assumption from chemical costs to technician wages. All formulas are unlocked, so you can adjust the recurring revenue business financial model to fit your specific territory or local market conditions without breaking the logic. It is defintely the most efficient way to stress-test your commercial cleaning franchise business plan before signing a lease.

Mapping out a 5-year trajectory is essential for evaluating the profitability of a service-based franchise. This model shows revenue scaling from $738,000 in Year 1 to over $2.19 million by Year 5, providing a clear view of long-term franchise unit financial performance projection. You can track how store-level EBITDA grows from $136,000 to $1.17 million as you gain density in your local market.

Franchise royalty fee projections are baked directly into the unit economics to ensure you see the true net margin after brand obligations. The model accounts for a 6% royalty and a 2% marketing fund contribution, which are standard for this commercial hygiene service business model. By factoring in the $60,000 initial franchise fee, you get a realistic look at the total cash required to remain compliant with brand standards.

Using a franchise startup cost calculator helps you identify exactly when the business stops burning cash and starts generating a return. This model identifies a 4-month window to reach the break-even point, which is fast for a B2B service franchise metrics profile. It details the $322,000 in hard costs, including vehicles and equipment, so you can manage your opening cash buffer effectively.

We have integrated essential financial metrics for B2B franchise operations, such as sanitation chemical costs ranging from 6% to 6.8% of sales. These built-in benchmarks allow you to compare your actual performance against researched standards for hygiene supplies and fuel expenses. It is a sanity check that ensures your financial forecasting for new franchise owners remains grounded in operational reality.


Simply purchase and download the financial model template, then access it instantly using Microsoft Excel or Google Sheets. No installation or technical expertise required-just open and start working.

Enter your business-specific numbers, including revenue projections, costs, and investment details. The pre-built formulas will automatically calculate financial insights, saving you time and effort.

Leverage the investor-ready format to confidently showcase your financial projections to banks, franchise representatives, or investors. Impress stakeholders with clear, data-driven insights and professional reports.

Leverage the investor-ready format to confidently present your projections to banks, franchise representatives, or investors.