
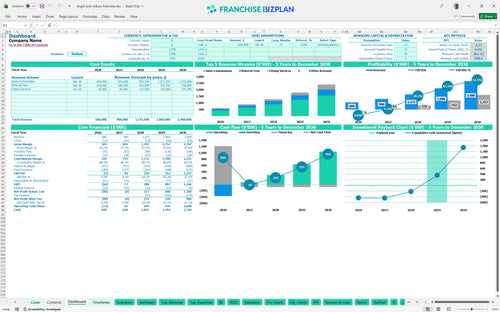
All-in-one Dashboard
Core inputs and core outputs


This franchise unit financial forecasting excel template includes a full suite of P&L statements, cash flow tools, and investment valuation metrics for a premium brokerage.
Core inputs and core outputs
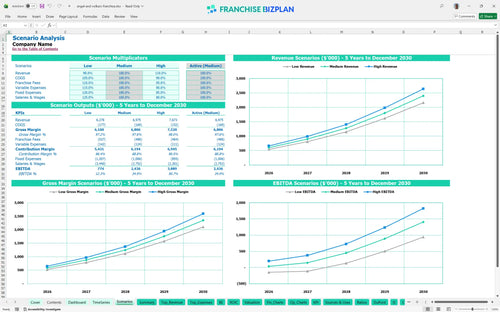
Three scenario analysis
Presentation ready
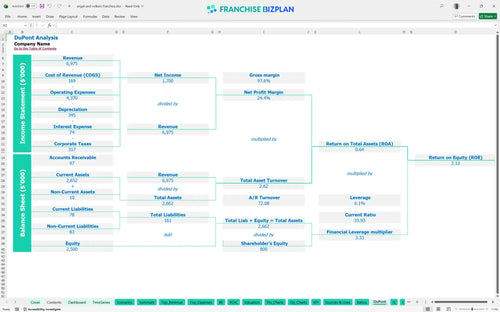
DuPont analysis
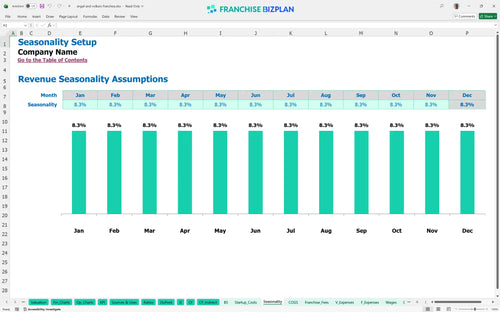
Researched revenue assumptions
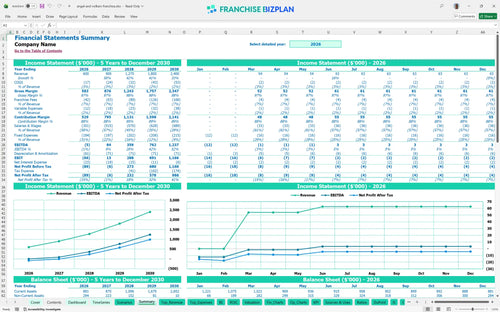
Lender-friendly financial outputs
Revenue stream detailed view
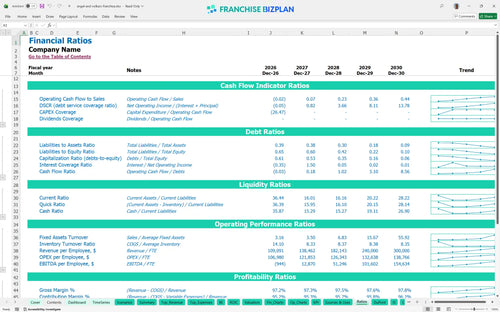
Performance metrics benchmark
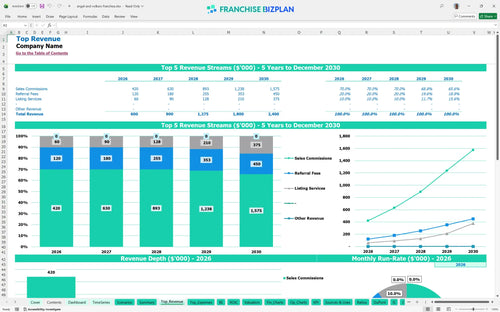
We built this financial model template for luxury real estate brokerage using detailed research on premium real estate operations. Key assumptions like sales commissions, gallery build-out costs, and advisor splits are pre-populated and ready for your specific inputs. Here is the quick math: with revenue projected to hit $1.275M by year three, the model helps you track the path from initial setup to a mature, high-volume office.
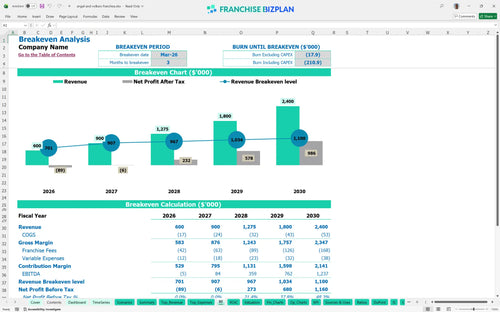
This luxury brokerage reaches EBITDA positivity in year two with $84,000 in earnings after a minor year-one loss of $5,000. By year five, the model projects an annual EBITDA of $1,237,000 as listing services and referral fees scale alongside core commissions.
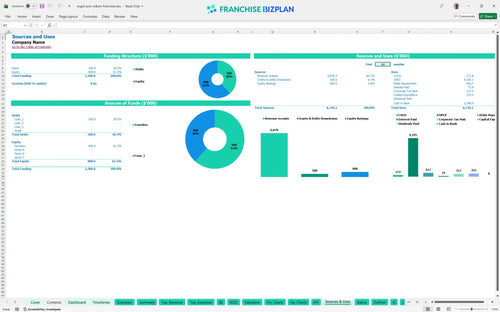
Launching this unit in the US requires significant upfront capital for a premium presence, totaling approximately $355,000 in initial CAPEX. This includes the $35,000 franchise fee, a $125,000 gallery build-out, and $75,000 for high-end digital display systems to attract foot traffic.
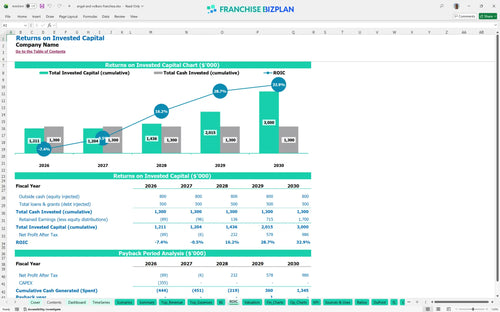
Our real estate franchise investment return analysis shows a 4.23% internal rate of return and a 2.13 return on equity. The payback period is estimated at 4 years, which is standard for high-CAPEX luxury retail-style brokerage models where brand equity takes time to ramp.
The monthly break-even point is reached in March 2026, just three months after the initial launch phase. This quick transition to covering costs defintely depends on hitting early sales commission targets and managing the $10,500 monthly prime location rent.
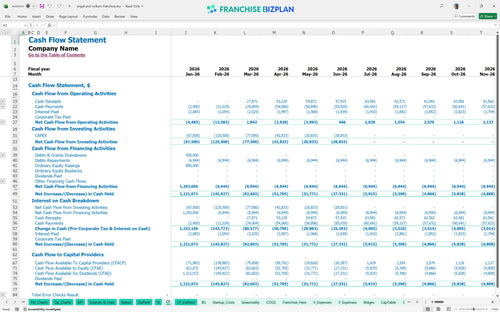
The lowest cash point occurs in December 2027 at $830,000, suggesting a need for strong liquidity during the first 24 months. You should maintain a cash buffer to handle the timing gaps between property listings, closings, and actual commission payouts.
Analyzing profitability for a new real estate franchise location requires looking at Low, Medium, and High cases. A 10% shift in sales volume significantly alters the year-one margin and can move the payback date by 12+ months depending on fixed cost coverage.
This franchise financial model template is fully customizable in Excel, featuring pre-filled formulas and editable assumptions. You can easily adjust the math to fit your specific territory, local market demand, and unique operating scenarios without building from scratch.

Planning for the long haul is easier with a detailed real estate franchise business plan that maps out five years of performance. We track revenue scaling from $600,000 in year one to $2,400,000 by year five, giving you a clear view of long-term equity growth and cash flow health.

Understanding royalty and marketing fees in real estate franchising is critical for protecting your bottom line. This model captures the 6% royalty and 1% marketing fund contributions, showing you exactly how these obligations impact your store-level margin before you sign a lease.

Use our franchise startup cost calculator to estimate the total initial investment, including the $35,000 fee and gallery build-out. The model identifies the specific sales volume needed to cover your $10,500 monthly rent and other fixed costs to reach sustainability.

We incorporate industry-specific benchmarks for luxury brokerage financial forecast models to help you sanity-check your numbers. By comparing your expected labor and occupancy costs against typical ranges, you can ensure your franchise unit economics stay competitive and realistic.


Simply purchase and download the financial model template, then access it instantly using Microsoft Excel or Google Sheets. No installation or technical expertise required-just open and start working.

Enter your business-specific numbers, including revenue projections, costs, and investment details. The pre-built formulas will automatically calculate financial insights, saving you time and effort.

Leverage the investor-ready format to confidently showcase your financial projections to banks, franchise representatives, or investors. Impress stakeholders with clear, data-driven insights and professional reports.

Leverage the investor-ready format to confidently present your projections to banks, franchise representatives, or investors.