
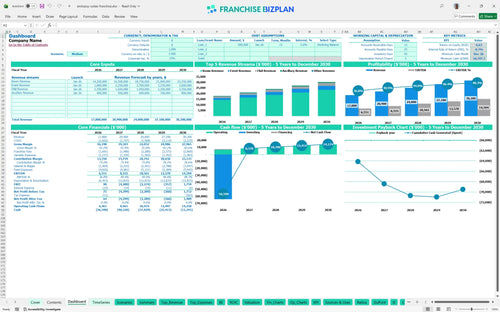
All-in-one Dashboard
Core inputs and core outputs


This franchise unit financial model template includes a detailed hotel development budget template for investors, covering everything from construction to five-year cash flow forecasting.
Core inputs and core outputs
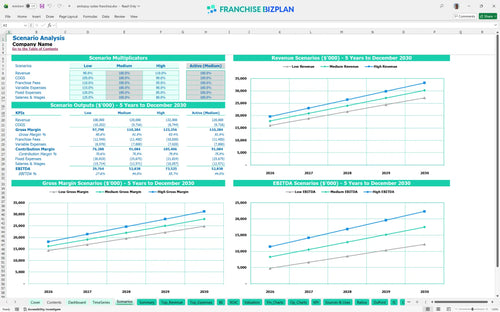
Three scenario analysis
Presentation ready
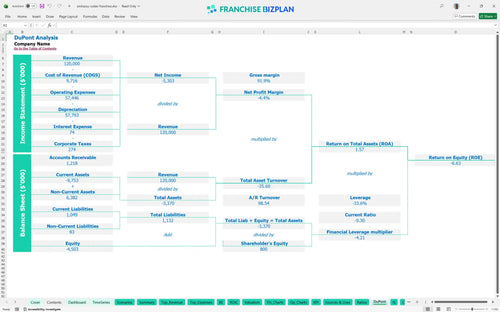
DuPont analysis
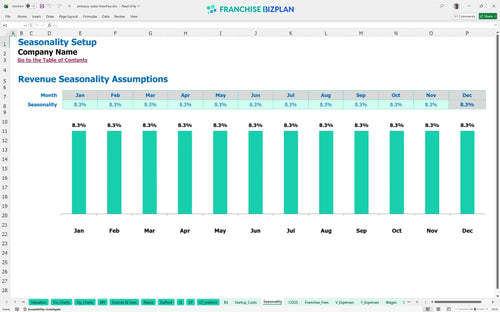
Researched revenue assumptions
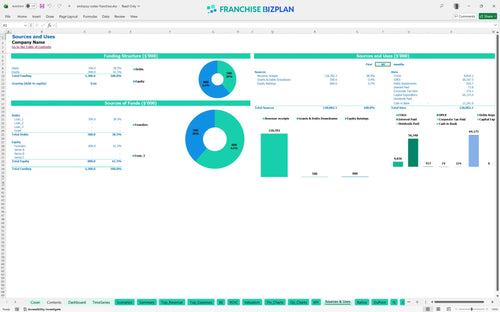
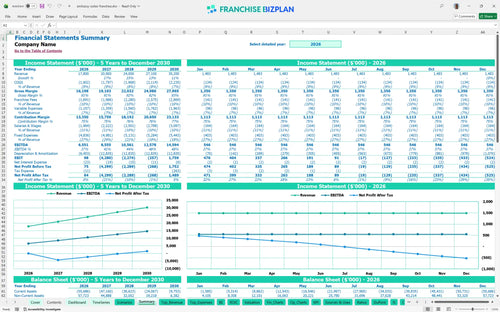
Lender-friendly financial outputs
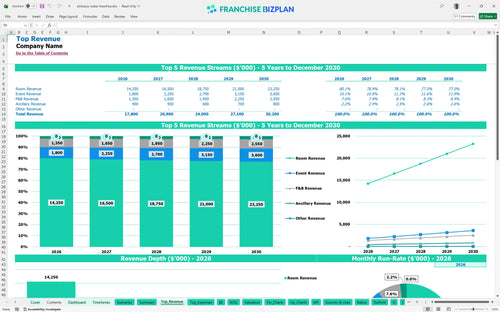
Revenue stream detailed view
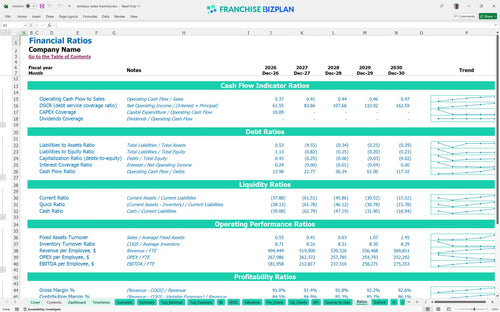
Performance metrics benchmark
We built this model using detailed research into upscale hotel operations to ensure the numbers reflect the reality of a high-end suite concept. Key assumptions like your $9.5 million starting room revenue and $1.2 million in event income are pre-populated but fully editable. This tool helps you see how a $6.5 million year-one EBITDA translates into long-term value for your portfolio.
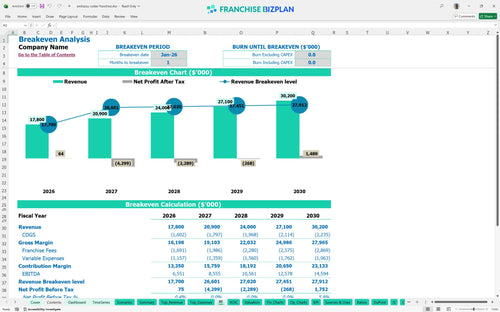
This unit hits its monthly break-even point almost immediately in January 2026, but true net profitability takes longer to stabilize due to the heavy debt service and depreciation typical of large hotel assets. With EBITDA growing from $6.55 million to $14.59 million by year five, the trajectory is strong once the ramp-up phase concludes. Here is the quick math: your room revenue is the engine, but event and F&B margins provide the fuel for growth.
To launch this unit in the US, you are looking at a total initial investment exceeding $64 million. The bulk of this is tied up in building construction ($42 million) and guestroom FF&E ($10.5 million). You also need to account for the $75,000 franchise fee and $2.2 million for HVAC systems. This is a heavy-lift hotel investment feasibility study that requires significant equity and debt financing to cover the pre-opening phase.
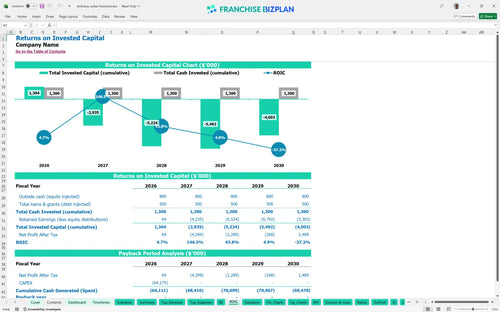
The ROI analysis for premium hotel franchise investments shows an IRR of -0.72% over the first five years, which is common for massive capital projects that haven't reached full maturity. Payback occurs after year five, meaning this is a long-term asset play rather than a quick cash flip. Still, the steady climb in revenue to $30.2 million suggests significant enterprise value is being built for the long haul.
The monthly break-even point is reached in January 2026, the very first month of operation. This is driven by the high volume of room revenue ($9.5 million in year one) which quickly covers the $250,000 monthly facility lease and $155,000 general manager salary. The biggest lever here is occupancy; if your room nights drop, the high fixed costs like property insurance and taxes will squeeze your margins fast.
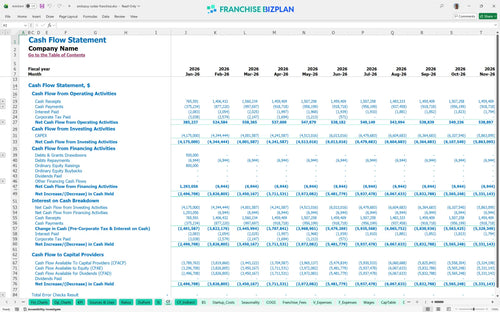
The lowest cash point is projected at -$56.59 million in December 2026, reflecting the massive construction and setup costs before the hotel fully ramps up its cash-generating operations. You need a significant capital stack or construction loan to bridge this gap. What this estimate hides is the potential for construction delays, which would push that low point even further out and increase interest carry.
In a High scenario where revenue exceeds the $17.8 million year-one target through better local marketing execution, your peak cash need decreases and your ROI improves significantly. A Low scenario, perhaps due to a dip in corporate tech travel, would delay your payback period and increase the pressure on your $300,000+ monthly fixed costs. Projecting revenue for business-focused hotel franchise units requires testing these sensitivities to ensure you have enough working capital.
This hotel franchise financial model is built in Excel to give you total control over your assumptions. You can adjust everything from room rates to seasonal occupancy without breaking the pre-filled formulas. It is a hospitality business plan template designed for real-world use, letting you swap out local labor rates or utility costs as your specific site requires. Honestly, a model is only as good as its inputs, so we made every cell editable to match your territory.

Planning a full-scale hotel requires looking way past the grand opening. This tool provides detailed franchise unit financial projections over a 5-year horizon, tracking revenue as it climbs from $17.8 million in year one to over $30 million by year five. You get a clear view of how EBITDA (earnings before interest, taxes, depreciation, and amortization) scales as your team gets more efficient. Long-term planning helps you spot the difference between a busy lobby and a profitable bottom line.

The franchise royalty fee structure is a major part of your monthly overhead. Our model specifically tracks the 5.5% royalty and 4% marketing fund contributions so you know exactly how much goes back to the brand. We also include the $75,000 initial franchise fee in your startup costs. Tracking these obligations ensures you are defintely calculating your store-level margin accurately before you sign the agreement.

Using this franchise startup cost calculator helps you map out the massive capital needed for a full-service hotel. We have included everything from the $42 million building construction to the $10.5 million for guestroom furniture and fixtures. Calculating break-even point for hotel franchise investment is tricky with such high fixed costs, but this model identifies exactly when your revenue covers your $250,000 monthly lease and other overhead.

We have baked in industry standards so you can see if your projections are realistic. Whether you are looking at Revenue per available room (RevPAR) or estimating operating expenses for full-service hotel franchise units, you need a baseline. The model helps you compare your 5% booking commissions and 1.5% payment fees against typical hospitality benchmarks. It is about making sure your plan holds up under scrutiny from lenders or partners.


Simply purchase and download the financial model template, then access it instantly using Microsoft Excel or Google Sheets. No installation or technical expertise required-just open and start working.

Enter your business-specific numbers, including revenue projections, costs, and investment details. The pre-built formulas will automatically calculate financial insights, saving you time and effort.

Leverage the investor-ready format to confidently showcase your financial projections to banks, franchise representatives, or investors. Impress stakeholders with clear, data-driven insights and professional reports.

Leverage the investor-ready format to confidently present your projections to banks, franchise representatives, or investors.