
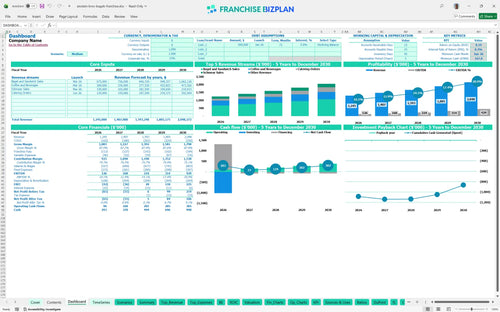
All-in-one Dashboard
Core inputs and core outputs


This food service franchise business plan tool provides everything a multi-unit operator needs to project cash flow, store-level margins, and total investment for a new location.
Core inputs and core outputs
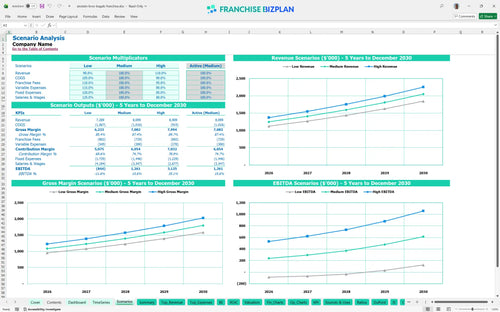
Three scenario analysis
Presentation ready
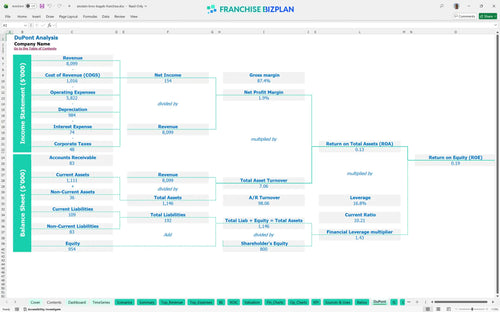
DuPont analysis
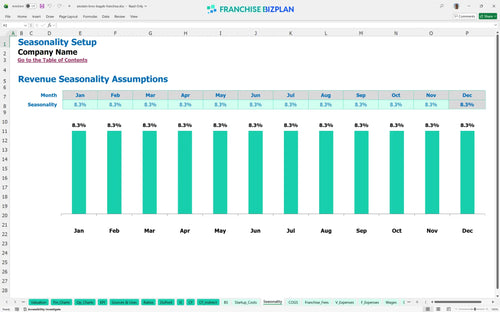
Researched revenue assumptions
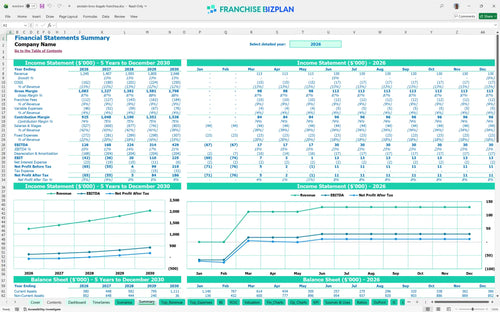
Lender-friendly financial outputs
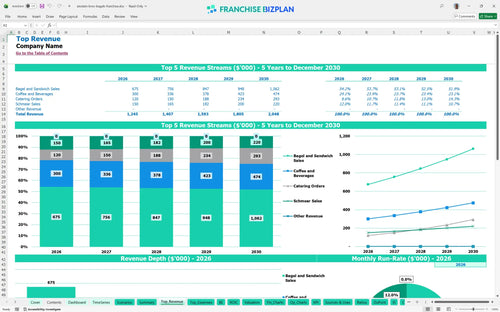
Revenue stream detailed view
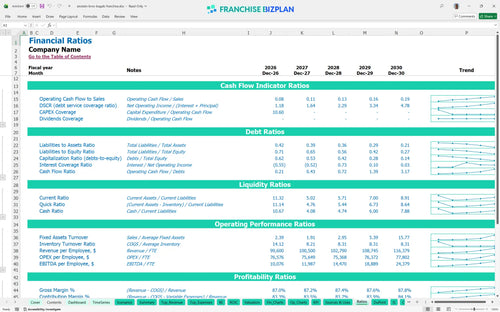
Performance metrics benchmark
We built this franchise unit financial model using our own research on this specific bakery concept. Key assumptions like the $120,000 catering revenue and 5% royalty fees are pre-populated and fully editable. This tool follows best practices for forecasting franchise catering revenue to ensure your B2B projections are realistic and actionable.
The unit becomes EBITDA positive in year 1, reaching $126,000 in earnings. By year 5, the franchise unit profitability calculator projects $429,000 in profit as you scale, making it a powerful tool for analyzing profitability for fast-casual breakfast franchises.
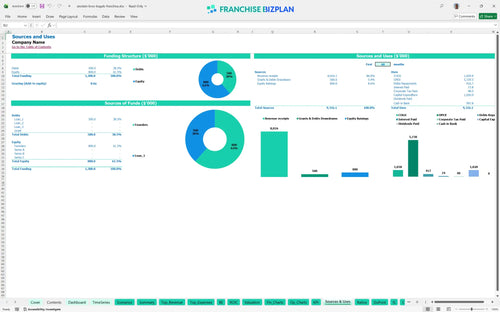
Launching this unit in the US requires roughly $1,020,000 in total capital for restaurant franchise startup costs. This includes the $35,000 franchise fee and $450,000 for leasehold improvements to get the doors open.
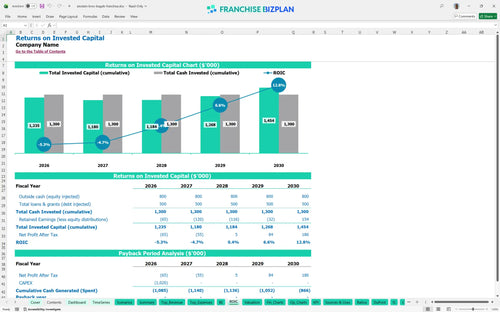
Investors can expect an IRR of 0.3 and a return on equity of 0.19 over the five-year period. While the unit generates cash quickly, the high initial investment means full payback defintely occurs after year five when evaluating ROI for food service franchise opportunities.
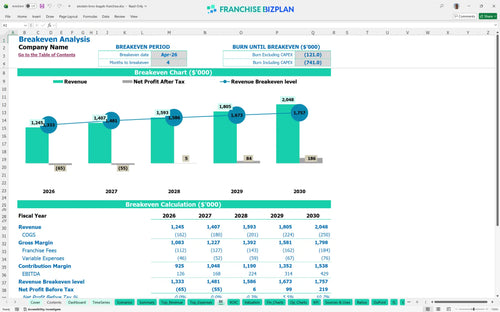
The unit hits its break-even analysis point in April 2026, just four months after opening. Learning how to build a financial forecast for a new franchise unit requires balancing the $15,000 monthly rent against high-volume morning traffic and catering orders.
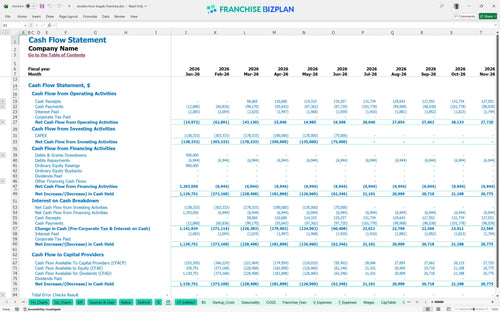
The lowest cash point hits $167,000 in June 2026, requiring a solid initial buffer to survive the ramp-up. This franchise business model template for multi-revenue stream locations helps you track the gap between retail sales and catering collections to keep the lights on.
Scenarios show that even a 10% dip in traffic significantly delays the $429,000 Year 5 EBITDA target. For multi-unit operations management, understanding these swings helps you decide when to trigger your next location opening or pull back on spending.
Finance: update unit break-even and payback model by Friday.
This franchise financial model template is a fully editable Excel tool designed for financial model template for new restaurant franchise locations. You can adjust every line item from bagel sales to shift lead wages to match your specific territory and local market conditions.

Our restaurant franchise financial projections excel spreadsheet provides a clear roadmap from launch to year five, showing revenue growing from $1.245 million to over $2.048 million. It handles capital expenditure forecasting for major items like the $150,000 drive-thru and $120,000 oven setup so you can plan for long-term growth.

Managing franchise royalty fee structures is simple with pre-set 5% royalty and 4% marketing fund inputs already baked into the math. These financial planning tools for independent franchise owners ensure you never miss the impact of off-the-top fees on your store-level EBITDA or take-home pay.

Use this bakery franchise investment analysis to understand how to calculate startup costs for a bakery franchise effectively before you sign a lease. With a $35,000 initial fee and heavy build-out costs, knowing your exact entry point is vital for managing your early-stage working capital.

We include unit economics benchmarks for calculating labor and food costs for bagel shop franchises to keep your operations on track. With food costs starting at 11% and labor spanning six different roles, staying within these guardrails is the only way to protect your bottom line.


Simply purchase and download the financial model template, then access it instantly using Microsoft Excel or Google Sheets. No installation or technical expertise required-just open and start working.

Enter your business-specific numbers, including revenue projections, costs, and investment details. The pre-built formulas will automatically calculate financial insights, saving you time and effort.

Leverage the investor-ready format to confidently showcase your financial projections to banks, franchise representatives, or investors. Impress stakeholders with clear, data-driven insights and professional reports.

Leverage the investor-ready format to confidently present your projections to banks, franchise representatives, or investors.