
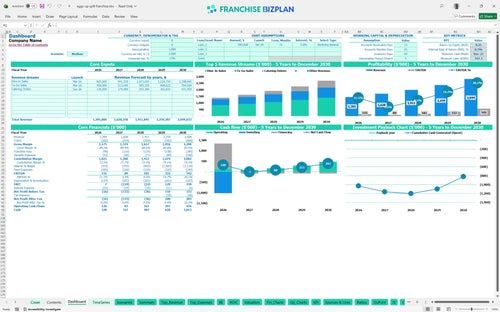
All-in-one Dashboard
Core inputs and core outputs


This Excel template for franchise unit financial forecasting provides a complete P&L, cash flow statement, and capital expenditure budget tailored for a high-volume breakfast and lunch operation.
Core inputs and core outputs
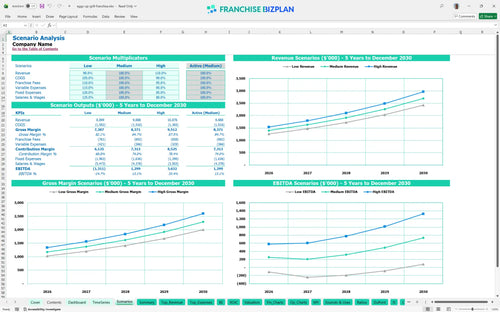
Three scenario analysis
Presentation ready
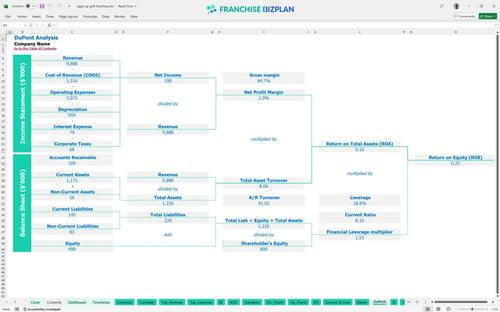
DuPont analysis
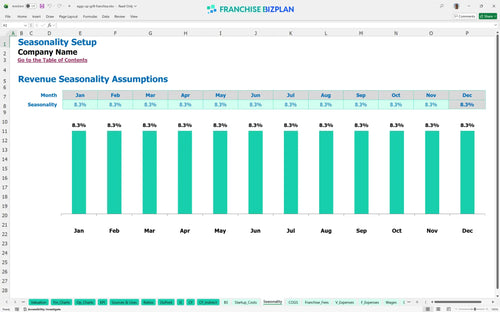
Researched revenue assumptions
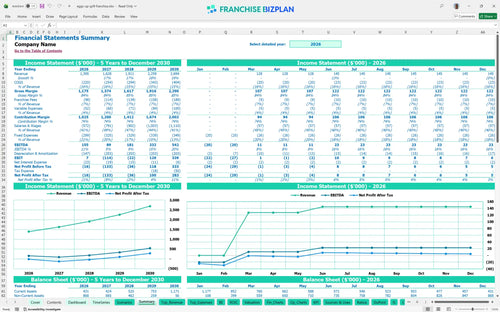
Lender-friendly financial outputs
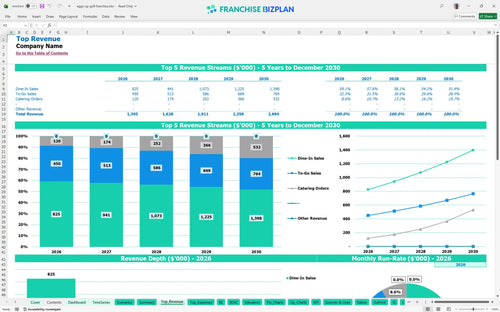
Revenue stream detailed view
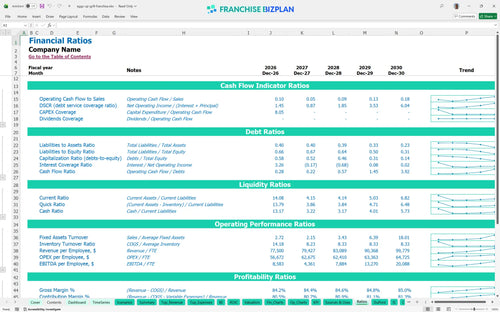
Performance metrics benchmark
We built this franchise unit financial model using our own research to help you navigate how to create a P&L for a new restaurant franchise. The model includes pre-populated data like the $1.39M Year 1 revenue target and a 34% IRR, but every field is fully editable to match your specific local market conditions. It is a practical tool for anyone estimating labor costs for restaurant franchise model success without the guesswork.
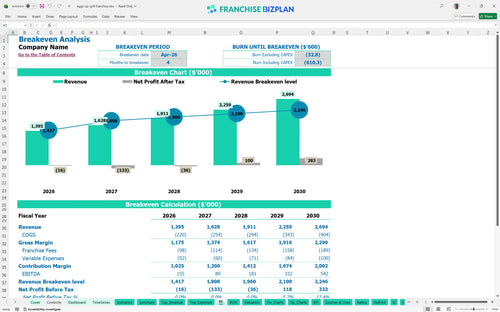
You can expect the unit to reach operational profitability by April 2026, just four months after opening. While Year 1 shows a $155,000 EBITDA, the model accounts for the ramp-up in labor as you scale from 8 to 12 servers to handle increased weekend traffic and peak breakfast demand.
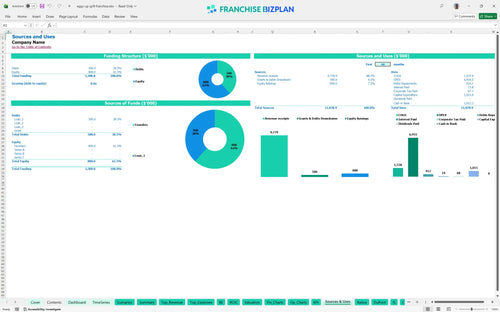
Total startup capital exceeds $1 million when you factor in the $45,000 franchise fee and significant build-out costs. This startup budget for neighborhood breakfast cafe franchise needs includes a cash buffer to handle the minimum cash point of $327,000 expected in late 2027 during the ramp-up phase.
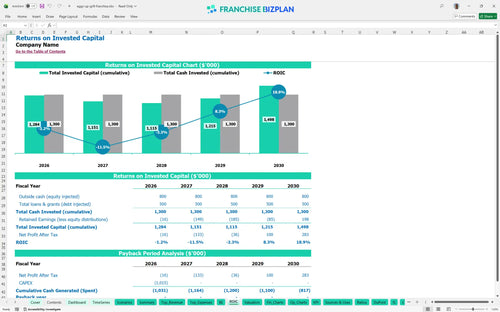
The restaurant franchise ROI calculator spreadsheet projects a 34% Internal Rate of Return (IRR) and a 25% Return on Equity (ROE). While the unit is highly profitable by Year 5 with $542,000 in EBITDA, the total payback period extends beyond the five-year mark due to the heavy initial $1.01M investment in assets.
Your monthly break-even happens in month 4, driven largely by the $18,000 monthly rent and the 7% combined royalty and marketing fees. To hit this fast, you need to maintain a strong mix of dine-in sales, which are projected to start at $550,000 annually and grow as the neighborhood discovers your location.
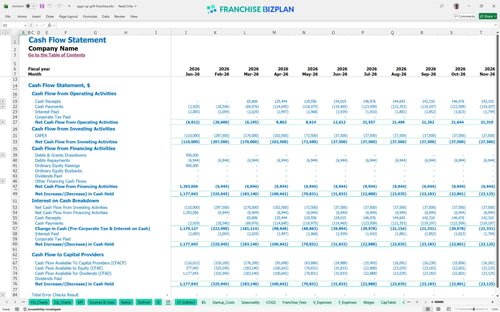
The lowest cash point hits $327,000 in December 2027, nearly two years after launch. This happens because of the timing of tax payments and the ramp-up in staffing costs, so keeping a healthy liquidity reserve is defintely required for this model to stay solvent during the second year.
A high-performing unit can push Year 5 revenue toward $2.69M, significantly improving the overall ROI. The financial projections for breakfast and lunch franchise show that even a 10% drop in volume can delay your break-even by several months, so local marketing execution is the biggest variable in your success.
Finance: update unit break-even and payback model by Friday.
This franchise financial model template is built in Excel, allowing you to swap out every assumption from rent to hourly wages. You can adjust the pre-filled formulas to match your specific territory, whether you are in a high-rent urban core or a suburban strip mall, making it the best financial model for quick service restaurant franchise planning.

Map out your growth from a $1.39M first year to over $2.69M by year five using this restaurant franchise business plan tool. It tracks how scaling dine-in and catering impacts your bottom line as the unit matures, providing a clear P&L statement template for multi-year oversight.

Understanding franchise royalty and marketing fees is vital for protecting your store-level margins. This model automatically calculates the 5% royalty and 2% marketing fund against your gross sales so you can see the exact cash impact on your operating expenses every single month.

Use the restaurant startup cost calculator to account for the $450,000 in leasehold improvements and $220,000 in kitchen equipment. The break-even analysis shows you exactly when your monthly volume covers the $18,000 rent and other fixed costs to ensure your franchise investment analysis is grounded in reality.

We included restaurant unit economics analysis template benchmarks to ensure your labor and food costs stay in line with industry standards. If your food ingredients exceed 14%, the model flags the variance so you can adjust pricing or portioning immediately to protect your franchise profitability projections.


Simply purchase and download the financial model template, then access it instantly using Microsoft Excel or Google Sheets. No installation or technical expertise required-just open and start working.

Enter your business-specific numbers, including revenue projections, costs, and investment details. The pre-built formulas will automatically calculate financial insights, saving you time and effort.

Leverage the investor-ready format to confidently showcase your financial projections to banks, franchise representatives, or investors. Impress stakeholders with clear, data-driven insights and professional reports.

Leverage the investor-ready format to confidently present your projections to banks, franchise representatives, or investors.