
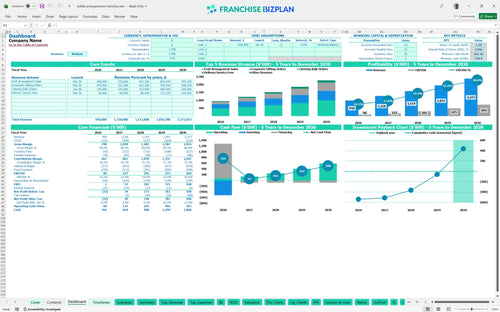
All-in-one Dashboard
Core inputs and core outputs


This franchise business model financial projection spreadsheet delivers a complete roadmap for navigating startup costs, monthly operations, and long-term ROI for a retail gifting unit.
Core inputs and core outputs
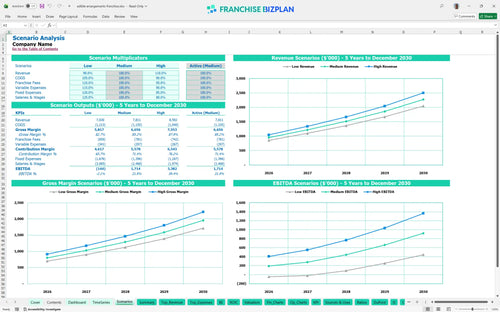
Three scenario analysis
Presentation ready
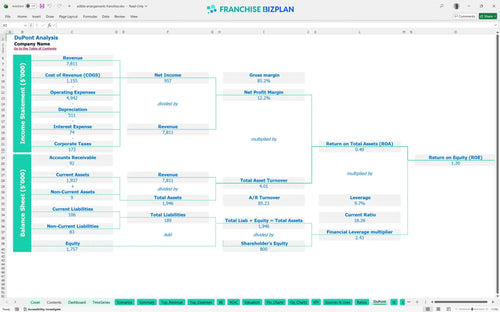
DuPont analysis
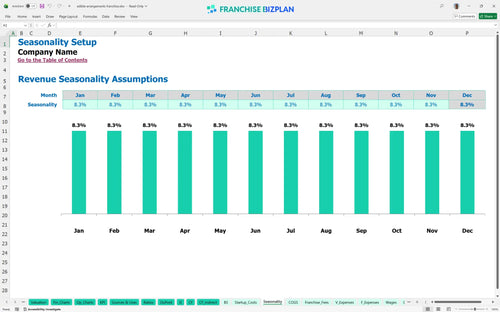
Researched revenue assumptions
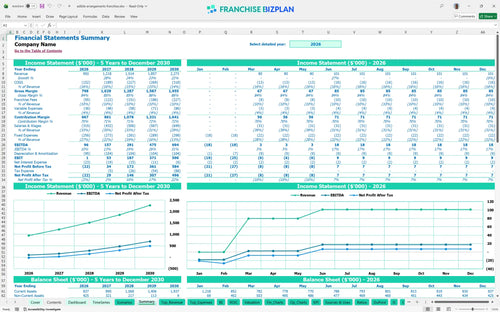
Lender-friendly financial outputs
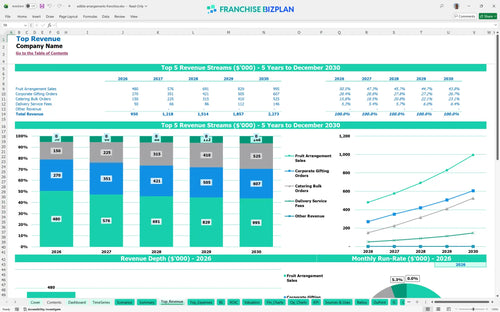
Revenue stream detailed view
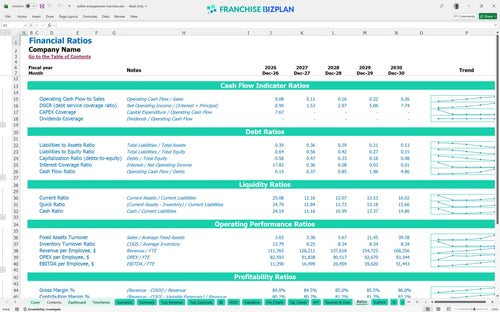
Performance metrics benchmark
We built this franchise unit financial model using deep research into the retail gifting and catering sector. Key assumptions, including the $950,000 Year 1 revenue target and the $14,000 monthly rent in high-traffic districts, are pre-populated and fully editable to match your specific Scottsdale or local territory data.
This unit becomes profitable quickly, hitting a positive EBITDA of $96,000 in its first year. By year five, the model projects an EBITDA of $694,000 as you scale corporate gifting and catering bulk orders to maximize the efficiency of your $65,000 store manager and production staff.
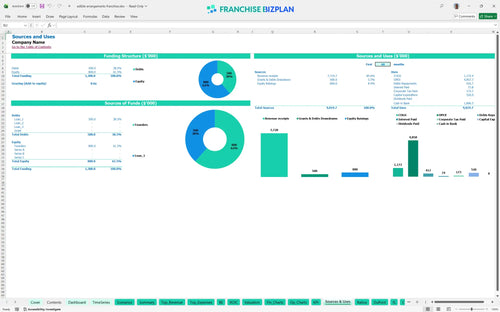
You need $520,000 to launch this unit, covering everything from the $30,000 franchise fee to $180,000 in leasehold improvements. The budget also accounts for $80,000 in delivery vehicles and $90,000 for refrigeration displays to ensure product freshness from the tasting bar to the customer's door.
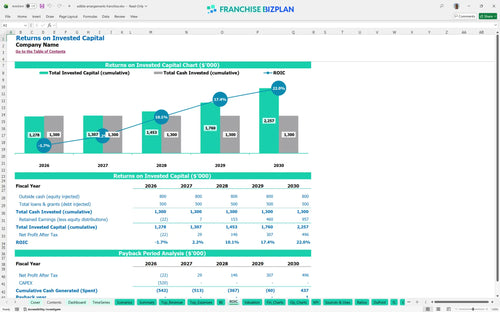
Investors can expect a 5-year payback period with an internal rate of return (IRR) of 2.8%. While the initial years focus on recouping the $520,000 investment, the return on equity (ROE) reaches 1.2 as the unit matures into a high-volume catering and retail operation.
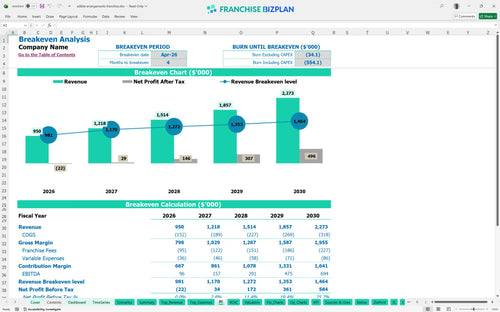
The unit reaches its monthly break-even point in April 2026, just four months after the March launch. The primary driver for this timeline is the high fixed cost of the $14,000 monthly rent, which requires consistent daily traffic and a strong average ticket from fruit arrangement sales.
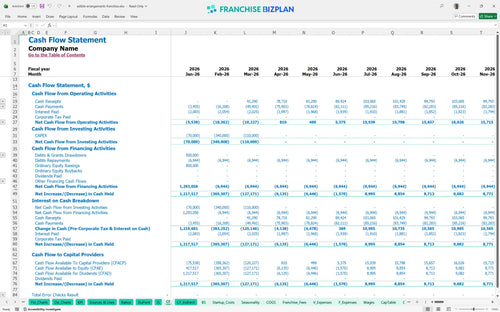
The lowest cash point occurs in June 2026 at $711,000, assuming you start with a healthy capital buffer. You need to maintain tight control over your $2,000 fleet vehicle lease and $2,500 utility bills during the first six months to ensure the ramp-up doesn't outpace your liquidity.
The High scenario assumes you hit $2,273,000 in annual sales by Year 5 through dominant local marketing and corporate contracts. A Low scenario would test your ability to survive on lower foot traffic while still paying the 10% combined royalty and marketing fee burden.
This franchise unit financial model is a fully customizable Excel tool designed for high-stakes decision making. You can adjust every assumption from revenue drivers to local labor rates, making it easy to adapt the franchise business plan excel to your specific territory and local market conditions.

Plan for the long haul with detailed franchise unit financial projections that span sixty months of operations. The model tracks your growth from a Year 1 revenue of $950,000 to a mature Year 5 target of $2,273,000, ensuring you see the full picture of your potential scale.

Managing the math behind a 5% royalty and a 5% marketing fee is critical for maintaining store-level margin. This tool automates these calculations based on your gross sales, so you defintely know exactly how much goes to the franchisor before you pay your own Waterfront district rent.

Knowing how to calculate franchise startup costs for a retail store is the first step toward a successful launch. With a total initial investment of $520,000 including leasehold improvements and refrigeration, this model identifies the exact sales volume you need to cover your fixed monthly overhead.

This franchise profitability analysis tool includes built-in benchmarks to help you sanity-check your numbers against industry standards. If your fruit ingredient costs stray far from the 13.5% target, the model helps you identify where the margin leak is happening in your kitchen operations.


Simply purchase and download the financial model template, then access it instantly using Microsoft Excel or Google Sheets. No installation or technical expertise required-just open and start working.

Enter your business-specific numbers, including revenue projections, costs, and investment details. The pre-built formulas will automatically calculate financial insights, saving you time and effort.

Leverage the investor-ready format to confidently showcase your financial projections to banks, franchise representatives, or investors. Impress stakeholders with clear, data-driven insights and professional reports.

Leverage the investor-ready format to confidently present your projections to banks, franchise representatives, or investors.