
All-in-one Dashboard
Core inputs and core outputs


This franchise unit financial model template provides a comprehensive toolkit for projecting revenue, managing expenses, and calculating the total investment required for a modern auto repair shop.
Core inputs and core outputs
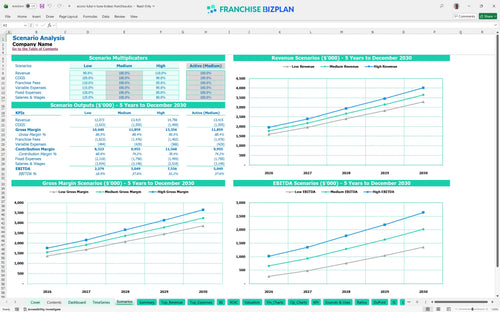
Three scenario analysis
Presentation ready
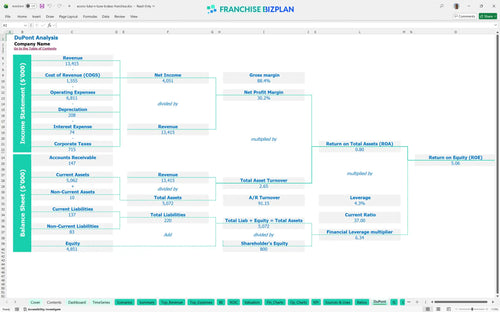
DuPont analysis
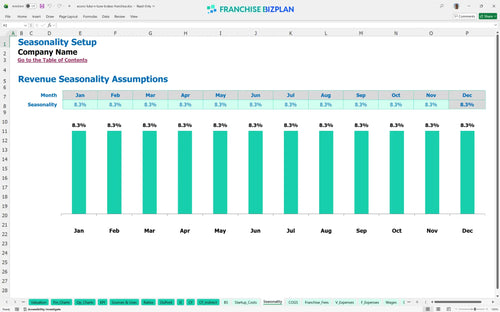
Researched revenue assumptions
Lender-friendly financial outputs
Revenue stream detailed view
Performance metrics benchmark
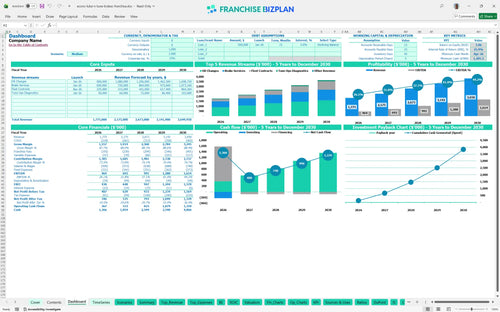
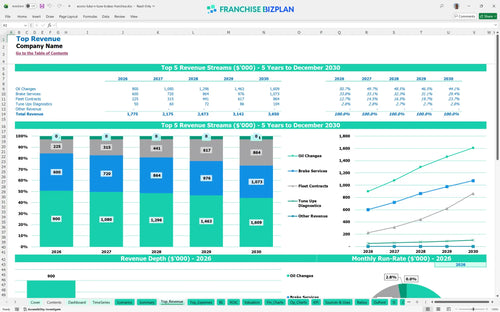
We built this franchise unit financial model using detailed market research on the automotive service sector. Assumptions for revenue streams like oil changes and brake services, plus costs like the 11% combined royalty and marketing fee, are pre-populated and fully editable. With a year-one revenue target of $1,775,000, this tool helps you stress-test every operational lever and perform a financial feasibility study for auto service franchise locations.
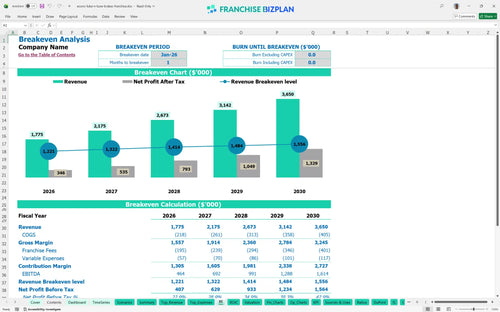
Based on the data, the unit reaches break-even almost immediately in January 2026. With EBITDA climbing from $464,000 in year one to over $1.6 million by year five, the model shows a strong upward trajectory as fleet contracts and repeat oil change business scale. Analyzing profit margins for automotive maintenance centers is easier when you see the net profit after all COGS and fixed costs.
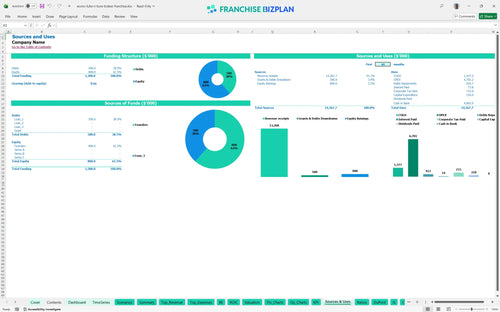
Launching this unit requires a significant initial investment, including a $30,000 franchise fee and $70,000 for leasehold improvements. The franchise startup cost analysis covers everything from $50,000 in lifts to a necessary cash buffer, ensuring you aren't caught short during the 2026 ramp-up. Here is how to calculate startup costs for a car repair franchise using the Sources and Uses logic.
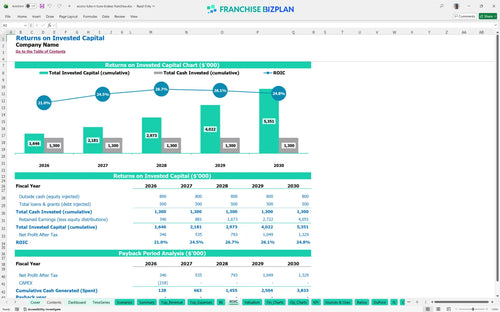
Investors can expect an Internal Rate of Return (IRR) of 25.9%, which is quite healthy for the automotive repair space. While the full payback occurs after year five, the 5.06 Return on Equity (ROE) reflects a business that generates significant cash flow once the initial equipment and build-out costs are stabilized. This franchise investment appraisal spreadsheet defintely helps clarify the long-term value.
The monthly break-even point is reached in the first month of operation, driven by a strong initial mix of oil changes and brake services. The biggest factor affecting this point is your fixed overhead, specifically the $18,000 monthly rent and the $270,000+ annual base payroll for your technical team. Using an Excel template for franchise unit financial planning makes these calculations instant.
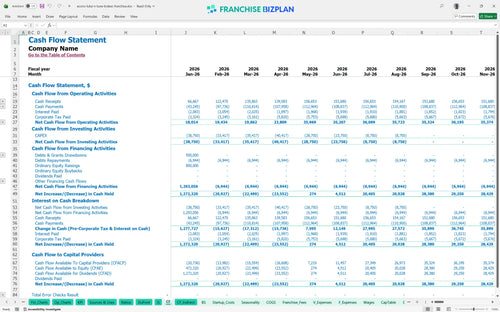
The lowest cash point occurs in April 2026 at $1,205,000, suggesting a need for substantial liquidity during the first quarter of operations. You'll need a solid franchise unit cash flow statement template to handle the timing gap between equipment payments and the full ramp-up of fleet contract revenue. Still, the cash position remains positive throughout the forecast.
Comparing scenarios shows that a 10% drop in revenue significantly delays the payback period, while a high-growth case pushes year-1 EBITDA well above the $464,000 baseline. The best financial model for small business franchise units demonstrates that small improvements in parts margins and labor productivity are the fastest ways to move to a high-performance outcome. Projecting fleet service revenue for auto shops is key to the high-case scenario.
Finance: update unit break-even and payback model by Friday.
This franchise financial model template is fully customizable in Excel, featuring pre-filled formulas and editable assumptions. You can easily adjust variables for your specific territory, local labor rates, and real estate costs to see how different operating scenarios impact your bottom line and overall unit performance.

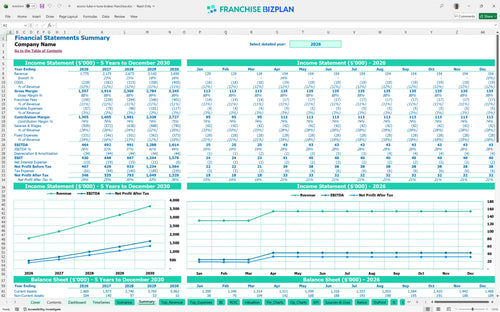
Plan your growth with detailed 5-year franchise unit financial projections covering revenue, costs, and cash flow. This automotive franchise profitability projection helps multi-unit operators and solo owners alike visualize the path from opening day to a mature, high-volume service center with over $3.6 million in annual sales.

The model precisely tracks your obligations to the franchisor, including the initial $30,000 fee and ongoing 5% royalty payments. By accounting for the 6% marketing fund contribution, you get a clear view of your store-level margin after all brand-related overhead and estimating ongoing royalty and franchise fees in Excel becomes a simple task.

Use this break-even analysis tool to estimate your total startup investment and the sales volume needed to cover monthly fixed costs like your $18,000 rent. It maps out the transition from initial build-out to positive cash flow, ensuring you have enough working capital for the ramp-up phase and a clear capital expenditure budget.

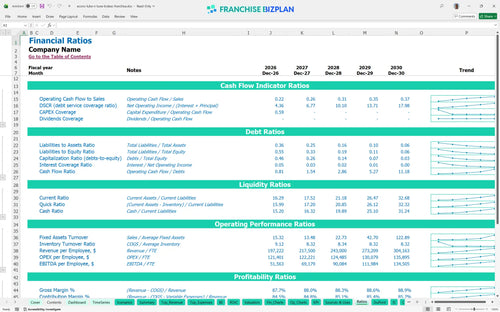
The model includes industry benchmarks to help you validate your automotive franchise revenue forecasting model. Compare your parts and fluid costs-starting at 9.5% of sales-against typical shop performance to identify potential margin leaks in your service bays and ensure your franchise unit performance metrics stay competitive.


Simply purchase and download the financial model template, then access it instantly using Microsoft Excel or Google Sheets. No installation or technical expertise required-just open and start working.

Enter your business-specific numbers, including revenue projections, costs, and investment details. The pre-built formulas will automatically calculate financial insights, saving you time and effort.

Leverage the investor-ready format to confidently showcase your financial projections to banks, franchise representatives, or investors. Impress stakeholders with clear, data-driven insights and professional reports.

Leverage the investor-ready format to confidently present your projections to banks, franchise representatives, or investors.