


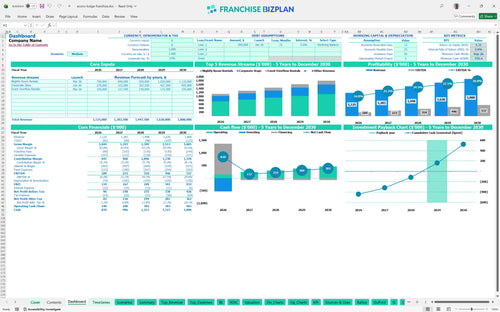
All-in-one Dashboard
Core inputs and core outputs



This franchise investment spreadsheet provides a complete roadmap for hotel owners, including automated cash flow statements, staffing plans, and ROI calculators. This is your complete toolkit for hospitality success.
Core inputs and core outputs
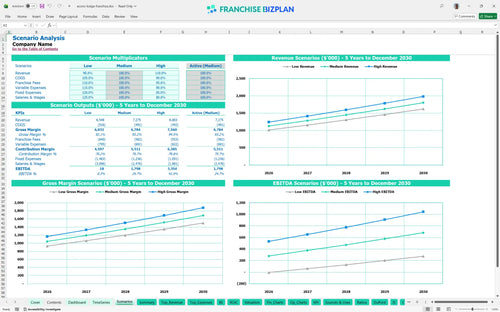
Three scenario analysis
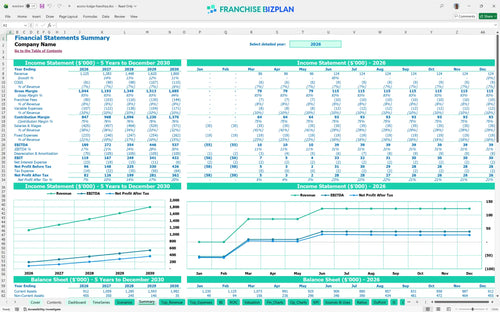
Presentation ready
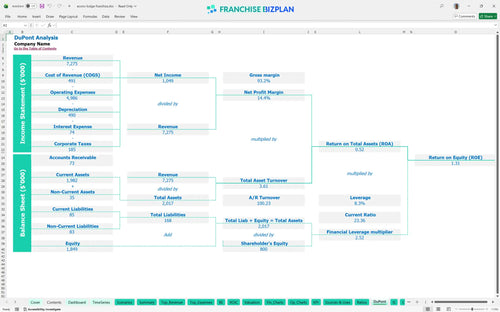
DuPont analysis
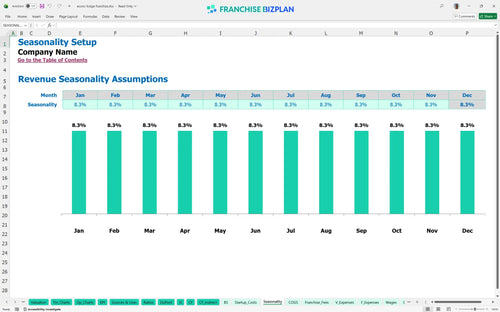
Researched revenue assumptions
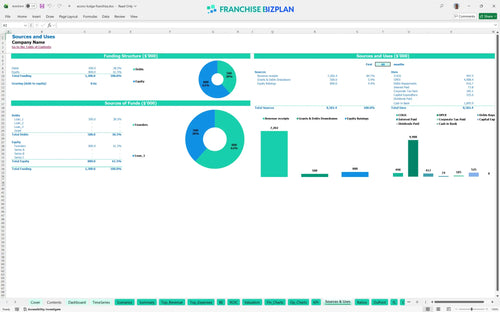
Lender-friendly financial outputs
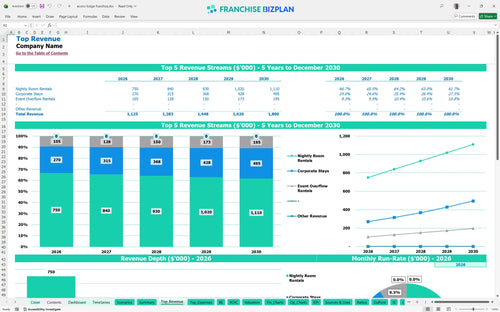
Revenue stream detailed view
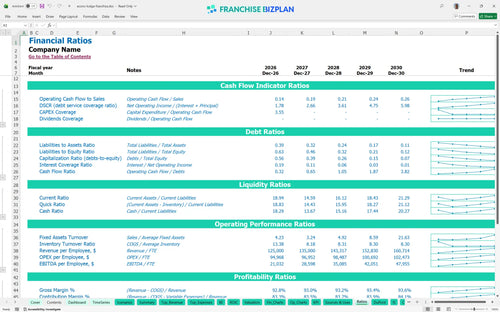
Performance metrics benchmark
We built this franchise unit financial model using extensive research into the economy lodging sector. Key assumptions, including the $12,000 monthly rent and $35,000 initial fee, are pre-populated and fully editable to match your specific market. Real data makes for better decisions.
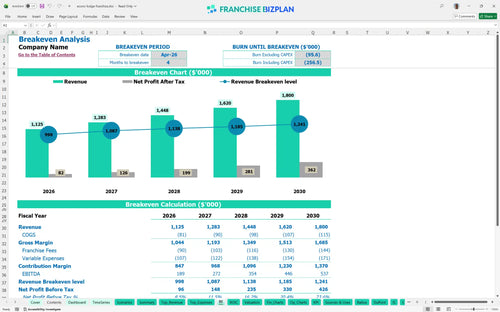
The unit hits its breakeven date in April 2026, just four months after launching. With Year 1 EBITDA projected at $189,000 and growing to $537,000 by Year 5, the budget hotel franchise profitability analysis shows a strong upward trajectory. Profitability is a function of occupancy and tight cost control.
You will need significant hotel startup capital to cover the $250,000 in leasehold improvements and $100,000 for furniture. The total initial investment also includes a $35,000 franchise fee and $40,000 for HVAC upgrades to meet modern standards. Your opening check is just the start of the story.
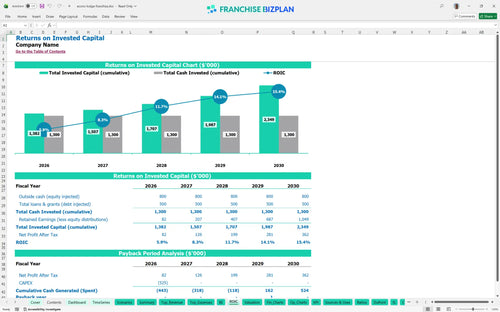
Estimating ROI for economy hotel franchise units shows a 4-year payback period and an Internal Rate of Return (IRR) of 3.89%. With a Return on Equity (ROE) of 1.31, the model demonstrates steady, predictable gains for long-term holders. Time is money, and four years is your target.
To reach breakeven in month 4, you need to clear your fixed costs, including $12,000 in rent and $3,000 in utilities. The primary driver for how to forecast revenue for a roadside hotel is nightly room rentals, which start at $500,000 in the first year. Volume is the engine that drives this model.
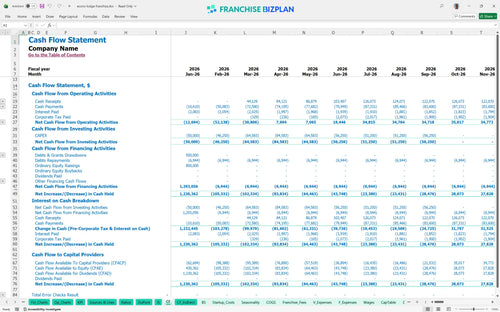
The franchise unit cash flow projection template identifies the lowest cash point as $755,000 in September 2026. This indicates you need a solid working capital buffer to handle the timing gap between renovation spend and mature occupancy levels. Cash is king, especially during the first year.
In a high-growth scenario, Year 1 revenue of $1,125,000 can scale faster if corporate stays exceed the $180,000 baseline. This financial model template for hotel business plan allows you to test how 5% royalty fees and 8% OTA commissions impact margins when occupancy fluctuates. Prepare for the worst but plan for the best.
Finance: update unit break-even and payback model by Friday.
This hotel franchise financial model is built in Excel with a logic-driven structure that lets you swap out any assumption. Whether you are adjusting nightly rates or changing the local labor mix, the pre-filled formulas update instantly to reflect your specific territory and operating scenario. Every cell is yours to change.

Plan your multi-year growth using detailed franchise unit financial projections that cover everything from Year 1 ramp-up to Year 5 maturity. This tool provides a clear view of your long-term profit potential, helping you secure financing or pitch to partners with a professional hotel business plan template. Plan for the next half-decade with confidence.

Managing the brand relationship requires analyzing hotel franchise royalty and marketing fees with precision. This model tracks the 5% royalty and 3% marketing fund contributions against your gross sales, ensuring you understand the true cost of the brand before you sign. Know exactly what you owe the brand every month.

Learning how to calculate hotel franchise startup costs is the first step to avoiding a liquidity crunch. We include a capital expenditure budget for hotel renovations, covering the $250,000 leasehold improvements and $100,000 furniture package required for brand compliance. Stop guessing when the bank account starts growing.

Our hospitality industry benchmarking helps you validate your operating expense forecast against sector standards. By comparing your RevPAR analysis (Revenue Per Available Room) to typical economy hotel performance, you can identify margin leaks in labor or utilities early. See how your numbers stack up against the pros.


Simply purchase and download the financial model template, then access it instantly using Microsoft Excel or Google Sheets. No installation or technical expertise required-just open and start working.

Enter your business-specific numbers, including revenue projections, costs, and investment details. The pre-built formulas will automatically calculate financial insights, saving you time and effort.

Leverage the investor-ready format to confidently showcase your financial projections to banks, franchise representatives, or investors. Impress stakeholders with clear, data-driven insights and professional reports.

Leverage the investor-ready format to confidently present your projections to banks, franchise representatives, or investors.