
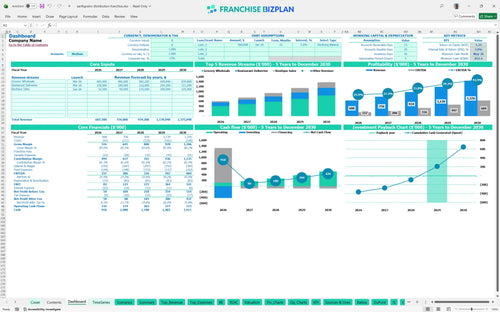
All-in-one Dashboard
Core inputs and core outputs


This small business financial model for distribution routes provides a comprehensive Excel template for bread delivery route business management, including detailed CAPEX tracking and 5-year EBITDA projections.
Core inputs and core outputs
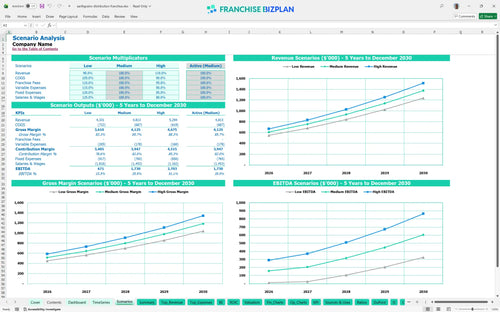
Three scenario analysis
Presentation ready
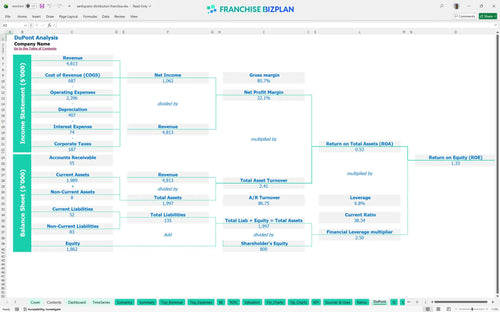
DuPont analysis
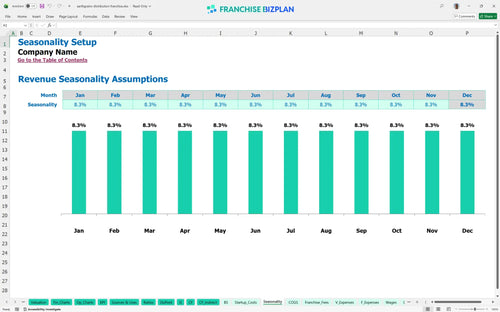
Researched revenue assumptions
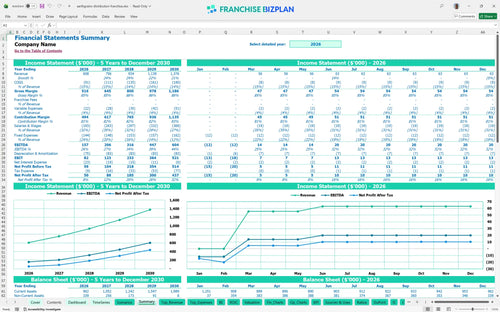
Lender-friendly financial outputs
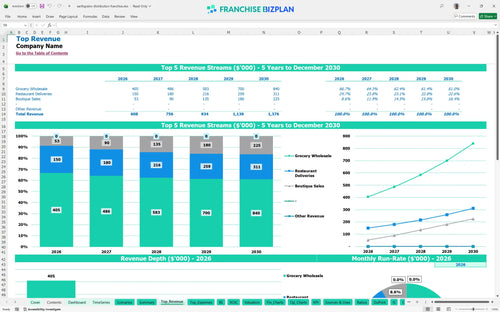
Revenue stream detailed view
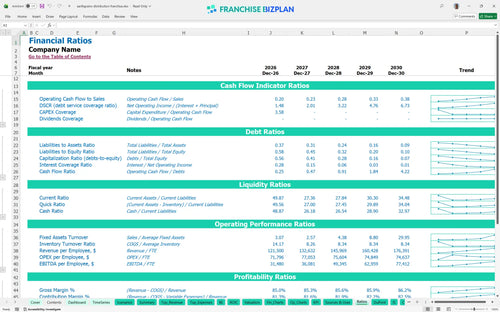
Performance metrics benchmark
We built this franchise unit profitability analysis using detailed research on route-based distribution models. Key assumptions for wholesale revenue, driver payroll, and vehicle maintenance are pre-populated with researched data and remain fully editable to fit your Austin-based territory. The model shows a strong year-one EBITDA of $157,000, providing a realistic starting point for your financial forecasting for route-based businesses.
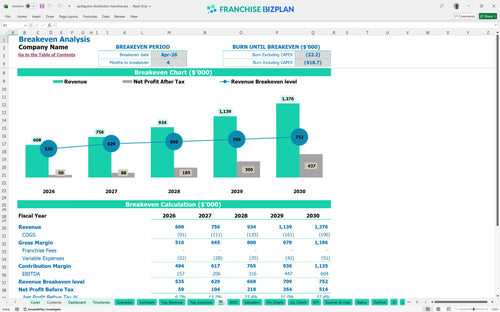
This distribution unit becomes profitable quickly, achieving breakeven by April 2026, just four months after launching. By year five, net profit scales significantly as EBITDA reaches $604,000, driven by expanding restaurant deliveries and boutique retail partnerships.
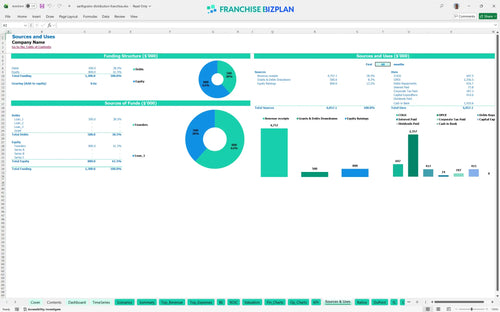
Launching this unit requires approximately $414,565 in initial capital to cover the franchise fee, equipment, and inventory. The largest allocation goes toward the $250,000 delivery truck fleet and $50,000 in initial inventory to stock high-volume grocery accounts.
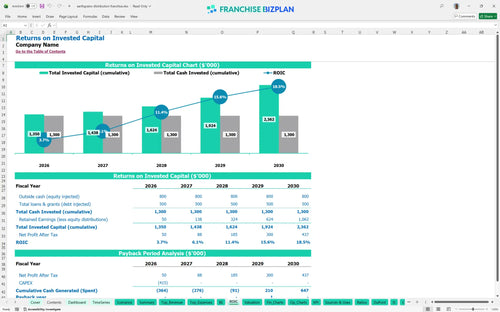
A franchisee can expect a 4-year payback period on their total investment. The model projects an Internal Rate of Return (IRR) of 3.95% and a Return on Equity (ROE) of 1.33, highlighting the stability of distributing essential food products through direct store delivery logistics.
The unit reaches break-even in April 2026. The primary driver for hitting this goal is the volume from grocery wholesale accounts, which must cover $11,000 in monthly fixed costs including warehouse rent, fleet insurance, and software subscriptions.
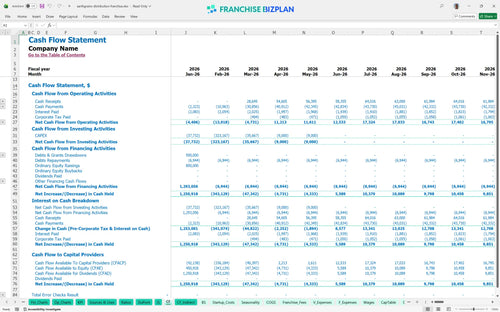
The lowest cash balance occurs in May 2026 at $851,000, requiring a significant initial liquidity buffer. Evaluating profitability of DSD franchise opportunities requires careful monitoring of this ramp-up period where supply chain management tools and fuel costs hit the balance sheet before wholesale collections peak.
A high-growth scenario focusing on boutique sales can defintely accelerate the 4-year payback period. Conversely, the low scenario shows that a 10% drop in wholesale volume delays profitability timing, making best practices for managing franchise logistics costs essential for protecting year-one margins.
This franchise unit financial model is fully customizable in Excel, featuring pre-filled formulas and editable assumptions that adapt to your specific territory. You can adjust the bread delivery route financial model to match your local labor rates, fleet size, and specific grocery account volume without breaking the logic.

Plan your multi-year growth with detailed 5-year revenue, cost, and cash flow projections designed for a distribution franchise business plan. The model shows how scaling from two to four delivery drivers impacts your bottom line as annual revenue grows from $608,000 in year one to over $1.37 million by year five.

The model captures all franchise-specific financial obligations, including the initial $14,565 fee and ongoing brand requirements. While our current data shows 0% for royalties, the tool allows for easy franchise royalty fee calculation to ensure you understand the real economics of your territory before you sign the agreement.

Estimate your total wholesale distribution startup costs, including the $250,000 investment for delivery trucks and $50,000 in initial inventory. This tool provides a clear break-even analysis, helping you determine the exact sales level required to cover fixed warehouse rent of $6,500 and monthly fleet insurance costs.

Our model incorporates built-in franchise and industry benchmarks for key operational efficiency metrics to help you sanity-check your numbers. Compare your 13.5% bakery product costs and driver wage structures against typical ranges to ensure your distribution unit remains competitive and profitable.


Simply purchase and download the financial model template, then access it instantly using Microsoft Excel or Google Sheets. No installation or technical expertise required-just open and start working.

Enter your business-specific numbers, including revenue projections, costs, and investment details. The pre-built formulas will automatically calculate financial insights, saving you time and effort.

Leverage the investor-ready format to confidently showcase your financial projections to banks, franchise representatives, or investors. Impress stakeholders with clear, data-driven insights and professional reports.

Leverage the investor-ready format to confidently present your projections to banks, franchise representatives, or investors.