
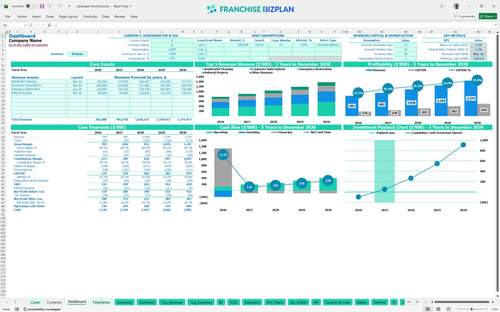
All-in-one Dashboard
Core inputs and core outputs


This financial model template for service-based franchises includes detailed revenue builds, staffing plans, and automated financial statements to de-risk your investment.
Core inputs and core outputs
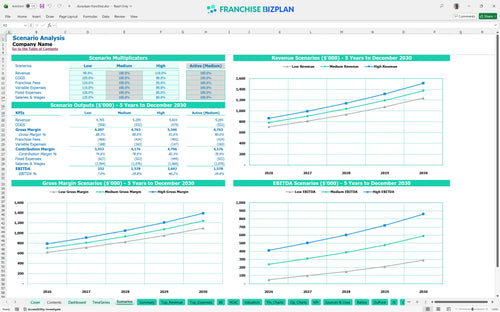
Three scenario analysis
Presentation ready
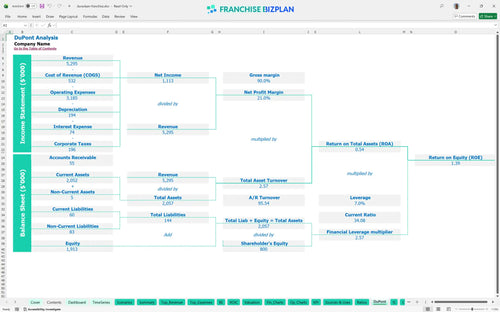
DuPont analysis
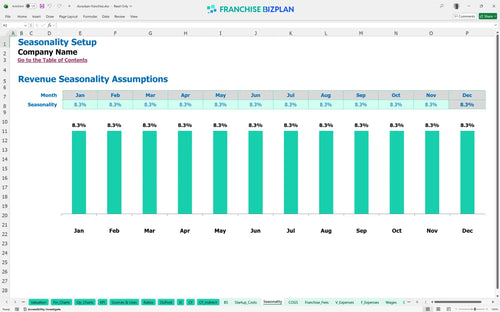
Researched revenue assumptions
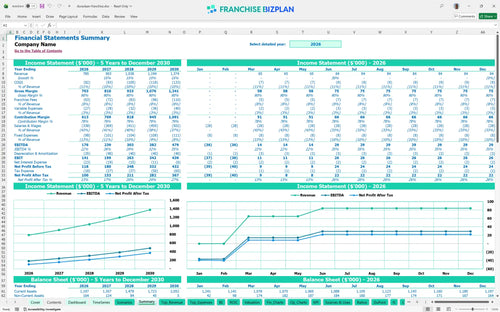
Lender-friendly financial outputs
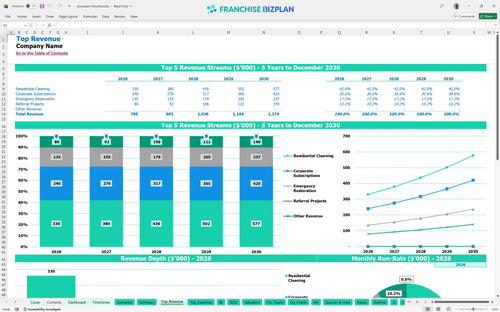
Revenue stream detailed view
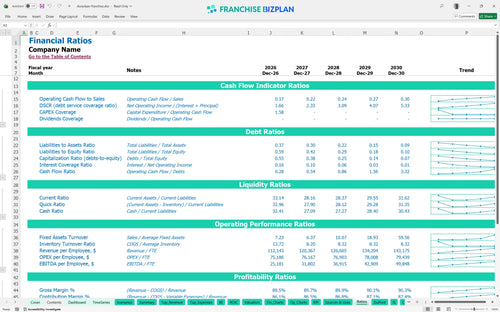
Performance metrics benchmark
We built this franchise unit financial model using our own research into the specialty cleaning sector. Key assumptions like the 8% royalty fee and the $199,000 initial investment are pre-populated and fully editable to match your specific territory. With a projected year-one revenue of $785,000 and a 2-year payback, the model helps you visualize the path to a $479,000 EBITDA by year five.
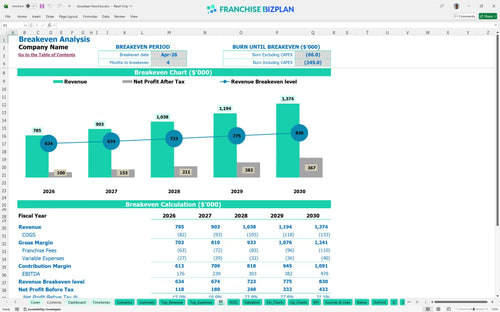
You can expect this unit to hit profitability quickly, with a break-even date of April 2026. By year one, the model shows an EBITDA of $176,000, which scales to $479,000 by year five as you optimize chemical use and labor. Speed to profit is your best defense.
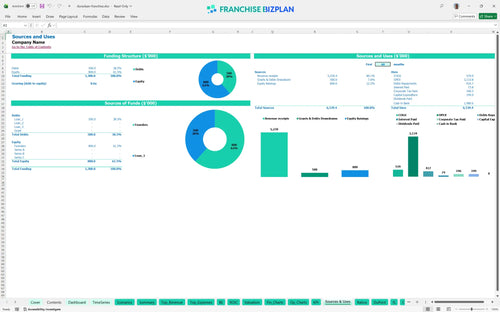
Launching this unit requires roughly $199,000 in upfront capital according to our franchise investment calculator. This covers the $29,500 initial fee, $70,000 for vans, and $45,000 for specialized foam equipment. You will also need to account for the $25,000 in leasehold improvements for your hub. Vans and gear are your biggest upfront hurdles.
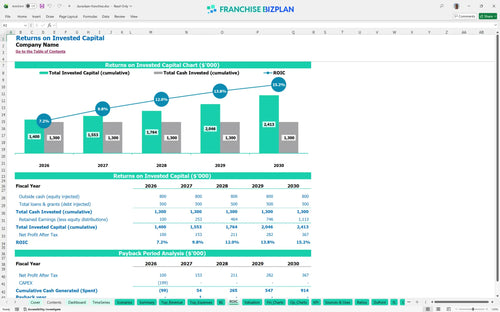
The franchise profitability analysis indicates a 7.08% Internal Rate of Return (IRR) and a Return on Equity (ROE) of 1.39. Most importantly, your initial investment should be fully paid back within 2 years, which is quite strong for a service-based model. Two years to get your money back is a solid win.
You reach break-even in just 4 months, specifically by April 2026. The main driver is the rapid ramp-up of residential cleaning and corporate subscriptions, which must cover about $8,200 in monthly fixed costs like rent and insurance. You will defintely need to track unit economics closely in those first 120 days. Volume is the only way to crush those fixed costs.
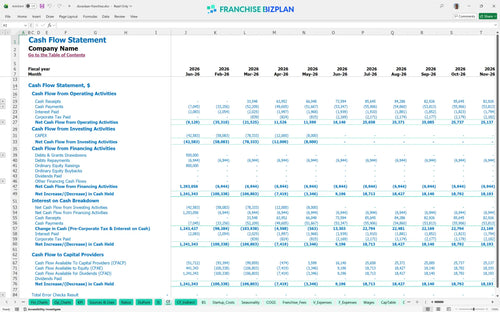
Your lowest cash point is projected for May 2026 at $1,023,000, which includes your initial funding buffer. This suggests you have plenty of runway, but you must keep a close eye on capital expenditure planning for equipment and van deliveries. Cash is oxygen; do not hold your breath too long.
Evaluating franchise profitability and ROI requires looking at different outcomes. If revenue drops 10% in a low case, your payback period might stretch, while a high-growth scenario driven by emergency restoration could push year-1 EBITDA well past $176,000. The high case is where the real wealth is built.
This franchise financial model template is built for speed and precision in Excel. You can swap out the pre-filled cleaning chemicals percentages or adjust the technician headcount as your territory grows. It is a living document where every formula is open, so you are not stuck with hard-coded numbers that do not match your local market. Every cell is open for your local tweaks.

Planning for a single unit requires a long-term lens to see how scaling from 3 to 5 technicians impacts the bottom line. This operating expense forecast projects revenue climbing from $785,000 in year one to over $1.37 million by year five. It tracks how EBITDA scales alongside that growth, giving you a clear view of future cash flow. Growth is a marathon, not a sprint.

Franchise royalty fees are a top-line hit that you need to model accurately to protect your margins. This tool calculates the 8% royalty fee automatically against your residential and corporate revenue streams. Since there is currently a 0% marketing fee in the data, you can see how that lack of brand fund burden helps your early-stage liquidity. Royalties are the price of the brand's power.

You need to know exactly when the bleeding stops and the profit starts. With a total initial investment covering everything from the $29,500 franchise fee to $70,000 for service vans, this startup cost projection spreadsheet maps out every dollar. It identifies the exact month when your specialty cleaning volume covers your $4,500 monthly rent and other fixed overhead. Knowing your zero-day is vital for survival.

Do not fly blind when estimating your cleaning franchise business plan. The model includes benchmarks for labor and consumables, like the 9% cleaning chemical cost in year one. These numbers help you verify if your $34,000 technician salaries are competitive or if your fuel costs are eating too much of your margin. Benchmarks keep your ego in check.


Simply purchase and download the financial model template, then access it instantly using Microsoft Excel or Google Sheets. No installation or technical expertise required-just open and start working.

Enter your business-specific numbers, including revenue projections, costs, and investment details. The pre-built formulas will automatically calculate financial insights, saving you time and effort.

Leverage the investor-ready format to confidently showcase your financial projections to banks, franchise representatives, or investors. Impress stakeholders with clear, data-driven insights and professional reports.

Leverage the investor-ready format to confidently present your projections to banks, franchise representatives, or investors.