
All-in-one Dashboard
Core inputs and core outputs


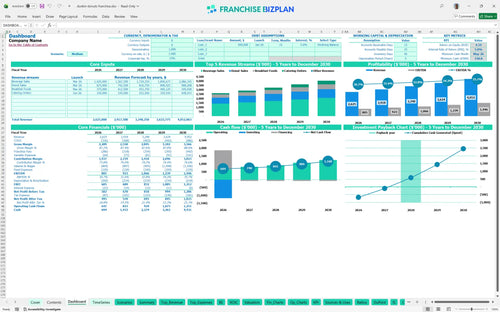
This model provides a complete financial roadmap for a high-volume coffee unit, covering everything from espresso equipment depreciation to peak-hour labor scaling.
Core inputs and core outputs
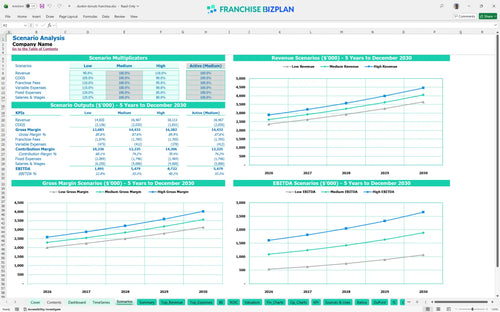
Three scenario analysis
Presentation ready
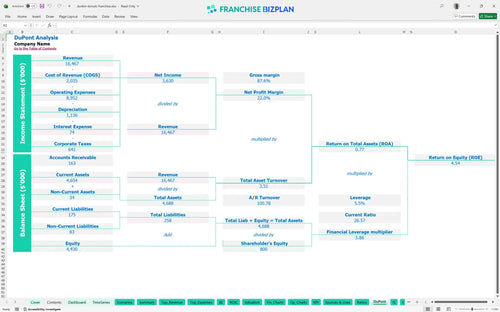
DuPont analysis
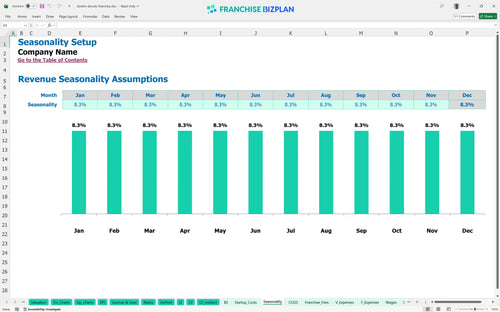
Researched revenue assumptions
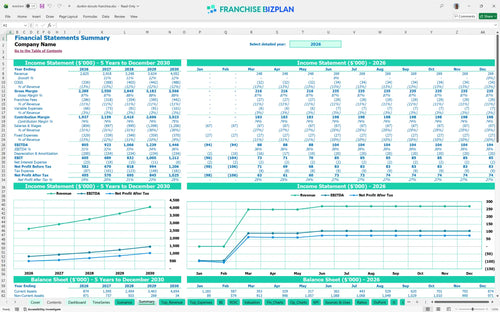
Lender-friendly financial outputs
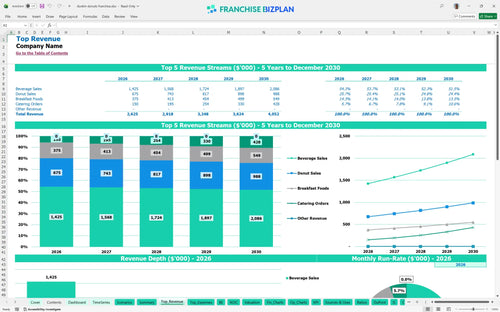
Revenue stream detailed view
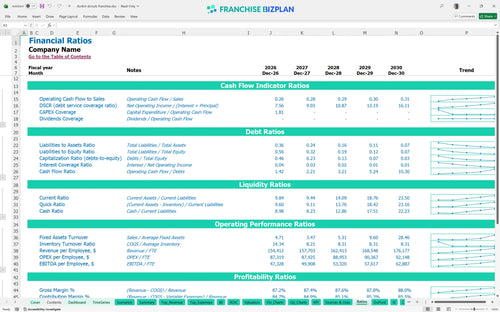
Performance metrics benchmark
We built this franchise unit financial model using our own research into high-traffic campus coffee locations. Key assumptions like the $2.62M year-one revenue and the $805k EBITDA are pre-populated and fully editable to match your specific site. This tool ensures your planning is based on realistic $20,000 monthly rent and 5.9% royalty obligations.
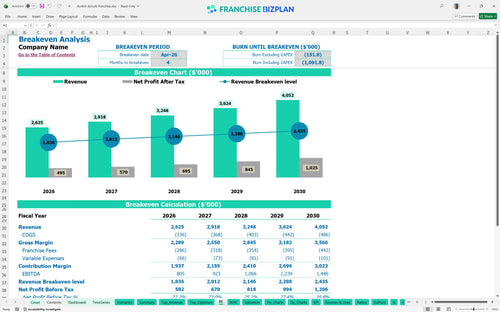
The unit hits profitability remarkably fast, reaching break-even by April 2026, just four months after launch. By using this franchise unit profit and loss template, you can see EBITDA grow from $805k in year one to $1.44M by year five as catering and beverage sales scale. Efficiency is the name of the game here.
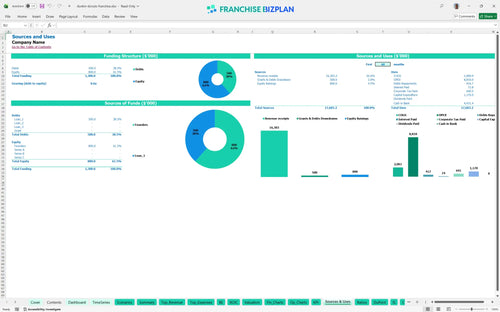
You need $1.17M to get the doors open, with the largest chunk going toward $500,000 in leasehold improvements for a prime campus spot. This franchise capital expenditure planning tool also accounts for $200,000 in espresso equipment and $150,000 for the bakery setup. Knowing how to calculate startup costs for a coffee franchise prevents mid-build-out funding surprises.
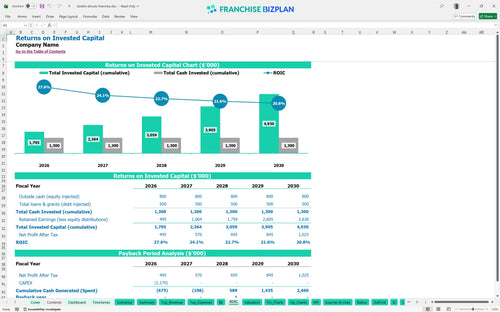
Investors can expect a 3-year payback period and an Internal Rate of Return (IRR) of 5.78% based on the $1.17M initial outlay. Using an Excel template for franchise unit profitability analysis shows a Return on Equity (ROE) of 4.54%. Estimating ROI for a quick service restaurant franchise helps you decide if this unit fits your portfolio's risk-reward profile.
The monthly break-even point is achieved in month 4, driven primarily by the high-volume beverage sales which are projected at $950,000 in the first year. This coffee shop franchise business plan assumes your $20,000 rent is fixed, making throughput your primary lever for covering costs. A solid financial planning guide for new franchise owners always prioritizes this early-stage survival metric.
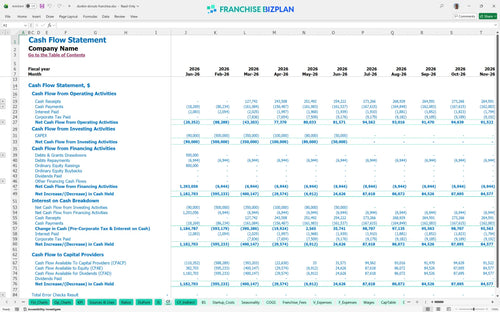
Your lowest cash point hits in May 2026 at $151,000, which provides a safe buffer but requires disciplined spending during the ramp-up. This coffee shop franchise operating expense breakdown shows that utilities and waste management add $3,600 to your monthly burn. You will defintely want to monitor this via the franchise feasibility study spreadsheet to ensure you don't dip below your minimum operating capital.
This franchise financial projection model for investors allows you to toggle between performance tiers to see how a 10% drop in traffic delays your 3-year payback. A commercial lease cost analysis is vital here, as the $20,000 rent stays fixed even if sales hit the low-case scenario. High-case performance is usually driven by superior local marketing and high-margin catering orders.
Finance: update unit break-even and payback model by Friday
This franchise financial model template is built in Excel to give you total control over your unit-level projections. You can adjust every driver, from beverage sales growth to hourly crew wages, ensuring the numbers reflect your specific urban or campus territory. The pre-filled formulas handle the heavy lifting so you can focus on testing different operating scenarios without breaking the math.

Success in food service operational forecasting requires looking beyond the first year of coffee sales. This model provides a detailed 5-year outlook, showing revenue climbing from $2.62M to over $4.05M as your local market presence matures. Use the franchise unit cash flow projection spreadsheet to track how annual EBITDA growth from $805k to $1.44M impacts your long-term wealth and scaling potential.

Managing the franchise royalty fee structure is critical because these costs come off the top line regardless of your margin. This is the best financial model for managing franchise royalty payments, specifically accounting for the 5.9% royalty and 5.0% marketing fund contributions. By automating these calculations, you can see exactly how $286,000 in annual brand fees affects your bottom line in year one.

A restaurant franchise startup cost analysis shows that high-traffic locations require significant upfront capital, totaling $1.17M in this model. Calculating break-even point for a campus coffee shop is simplified here, identifying that you hit the black by April 2026. This section helps you visualize the gap between your initial $90,000 franchise fee and the moment the unit starts paying you back.

We use real-world restaurant unit economics to set the baseline for your projections, including a $20,000 monthly rent for prime real estate. Analyzing labor and inventory costs for coffee franchises becomes easier when you compare your 11% ingredient cost against industry standards. These benchmarks act as a sanity check for your $80,000 manager salary and other fixed overheads.


Simply purchase and download the financial model template, then access it instantly using Microsoft Excel or Google Sheets. No installation or technical expertise required-just open and start working.

Enter your business-specific numbers, including revenue projections, costs, and investment details. The pre-built formulas will automatically calculate financial insights, saving you time and effort.

Leverage the investor-ready format to confidently showcase your financial projections to banks, franchise representatives, or investors. Impress stakeholders with clear, data-driven insights and professional reports.

Leverage the investor-ready format to confidently present your projections to banks, franchise representatives, or investors.