
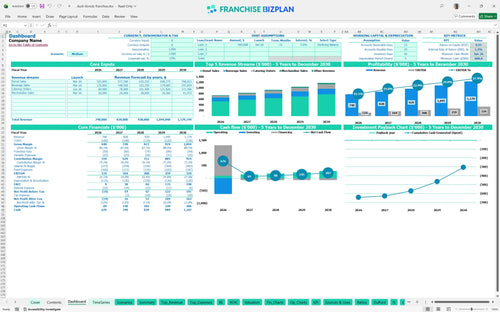
All-in-one Dashboard
Core inputs and core outputs


This comprehensive Excel spreadsheet template for franchise financial forecasting provides everything a prospective owner needs to evaluate a donut shop business plan, from initial CAPEX to 5-year exit values.
Core inputs and core outputs
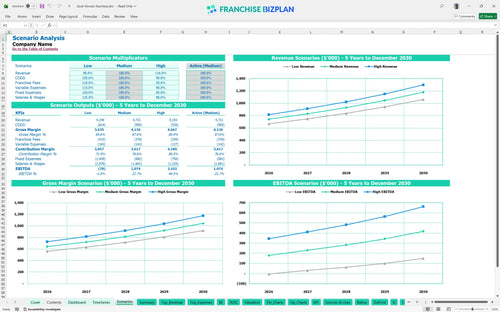
Three scenario analysis
Presentation ready
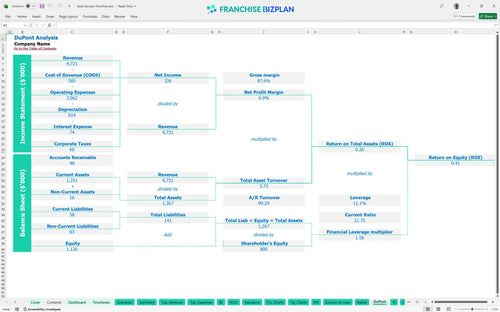
DuPont analysis
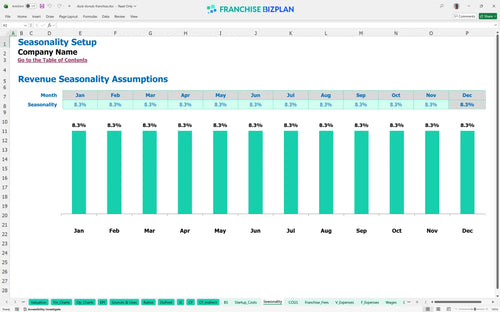
Researched revenue assumptions
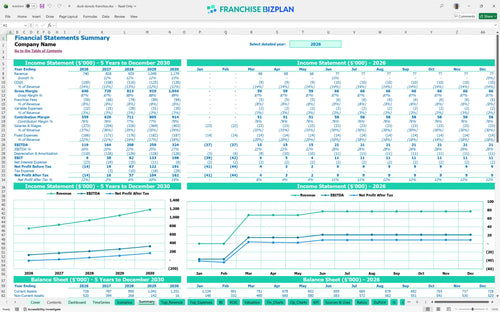
Lender-friendly financial outputs
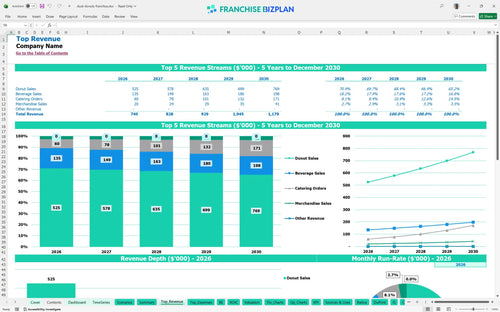
Revenue stream detailed view
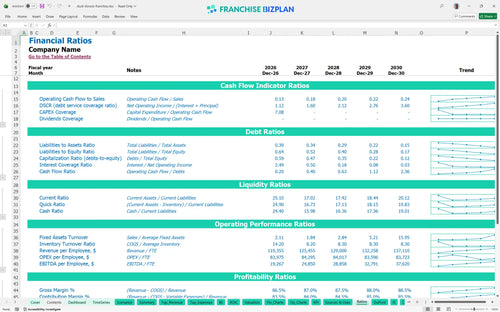
Performance metrics benchmark
We built this model using detailed research on the donut shop's unit economics and standard operating procedures. The pre-populated data covers everything from the $40,000 franchise fee to the specific equipment costs, ensuring your ROI analysis for food and beverage franchises is grounded in reality. All inputs, including the projected $740,000 year-one revenue and 5% royalty, are fully editable to match your specific market conditions.
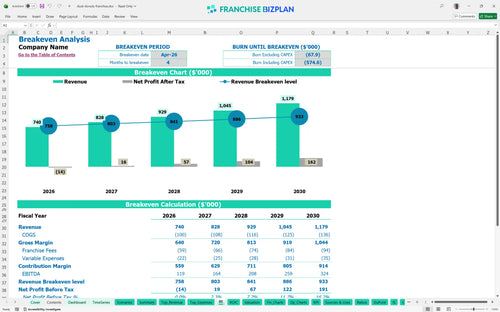
The model shows this unit hitting positive EBITDA in its first year, with $119,000 in earnings. By year five, as revenue climbs toward $1.17M, the operational profit margin expands significantly due to fixed-cost leverage. You'll defintely see the impact of scaling catering orders, which are projected to grow from $40,000 to over $114,000 by year five while estimating revenue for a donut shop franchise.
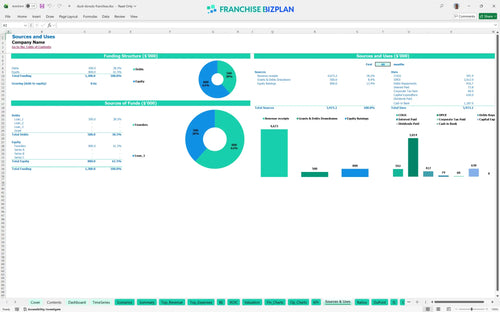
You will need approximately $630,000 in upfront capital to cover the initial build-out and equipment while learning how to calculate startup costs for a food franchise. This includes $250,000 for leasehold improvements and $180,000 for specialized donut and beverage production machinery. The model also accounts for a $40,000 franchise fee and $40,000 for signage to ensure brand standards are met from day one.
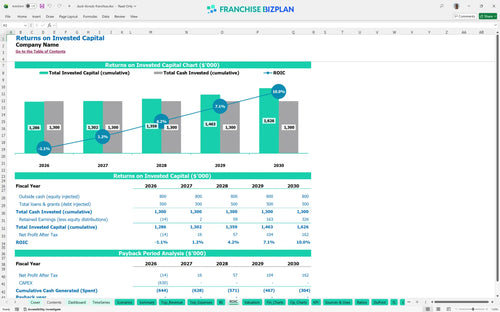
Based on the current projections, the franchise investment analysis estimates an Internal Rate of Return (IRR) of 1.18% and a Return on Equity (ROE) of 0.41. While the unit generates strong annual EBITDA, reaching $324,000 by year five, the high initial investment means full payback occurs just after the five-year mark. This is typical for a retail franchise unit with significant leasehold and equipment requirements.
The unit is projected to reach its break-even date in April 2026, just four months after launching. To cover the $9,000 monthly rent and $15,000+ in management salaries, you need to maintain consistent daily foot traffic. Using this franchise unit operating expense tracker, you can see that labor efficiency is your biggest lever, as crew member costs scale with volume while management remains a fixed burden.
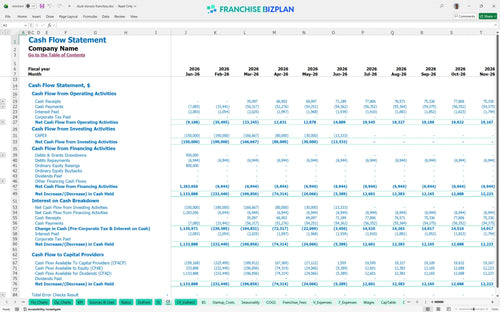
The lowest cash point occurs in June 2026, with a minimum cash balance of $601,000 required to weather the initial ramp-up. This includes your startup budget template for small business owners and a buffer for the first few months of operations. If your build-out takes longer than 90 days, you'll need to watch this runway closely using the best financial planning template for new franchise owners to avoid a liquidity crunch.
The model allows you to toggle between scenarios when creating a business plan for a quick-service restaurant to see how a 10% drop in sales affects your year-1 margin. In a high-performance scenario where catering hits its targets early, the peak cash need for this financial model for new retail franchise unit drops and the payback period accelerates. Conversely, if labor runs 5% over budget, your EBITDA will take a direct hit, delaying your return on investment.
Finance: update unit break-even and payback model by Friday.
This franchise unit financial model lives in Excel, giving you total control over every line item. You can swap out the pre-filled assumptions for your specific territory or lease terms without breaking the math. It's a flexible franchise startup cost calculator designed to handle everything from local labor spikes to shifting ingredient costs.

Success in the donut business requires looking past the grand opening. This tool provides a detailed 5-year outlook on revenue, cash flow, and net profit to help you see the long-term potential of your investment. It functions as a restaurant financial projection template that tracks how scaling from one unit to a small chain impacts your bottom line over time.

Royalties and marketing funds are 'off the top' expenses that can squeeze margins if you aren't careful. This model builds in specific royalty fee calculation logic to ensure you account for every dollar sent back to the franchisor. By modeling these obligations upfront, you get a realistic view of your store-level EBITDA after all brand-mandated costs are paid.

Getting the doors open is the biggest hurdle, so we've included a robust franchise startup cost calculator. You'll be able to see exactly how much cash is tied up in equipment and leaseholds versus working capital. The break-even analysis shows the exact daily volume needed to cover your $9,000 monthly rent and other fixed overhead.

Don't guess on your operational profit margin. The model includes industry-standard benchmarks for labor, COGS, and occupancy costs so you can see if your projections are realistic. This helps you identify margin leaks early, ensuring your bakery franchise profitability analysis tool reflects the actual performance of top-tier operators in the quick-service space.


Simply purchase and download the financial model template, then access it instantly using Microsoft Excel or Google Sheets. No installation or technical expertise required-just open and start working.

Enter your business-specific numbers, including revenue projections, costs, and investment details. The pre-built formulas will automatically calculate financial insights, saving you time and effort.

Leverage the investor-ready format to confidently showcase your financial projections to banks, franchise representatives, or investors. Impress stakeholders with clear, data-driven insights and professional reports.

Leverage the investor-ready format to confidently present your projections to banks, franchise representatives, or investors.