
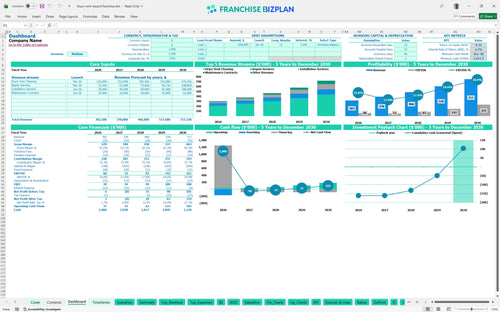
All-in-one Dashboard
Core inputs and core outputs


This financial model for service-based franchise startup provides a complete Excel-based toolkit including 5-year P&L, cash flow statements, and automated ROI calculators for prospective owners.
Core inputs and core outputs
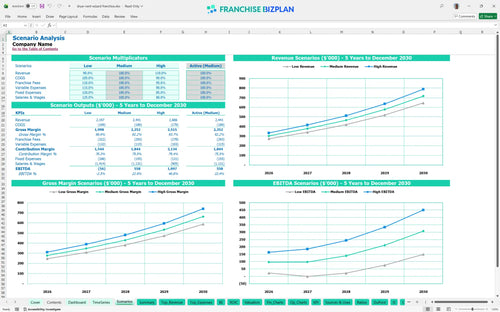
Three scenario analysis
Presentation ready
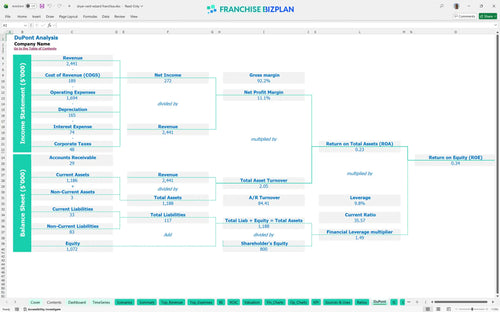
DuPont analysis
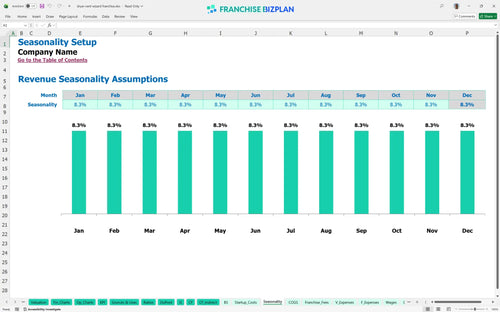
Researched revenue assumptions
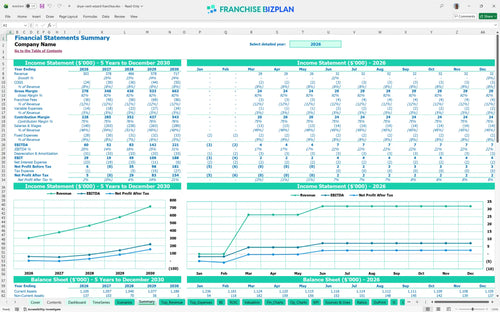
Lender-friendly financial outputs
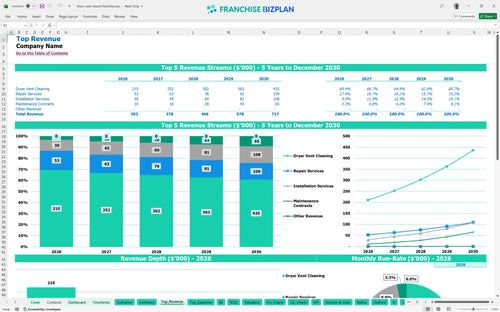
Revenue stream detailed view
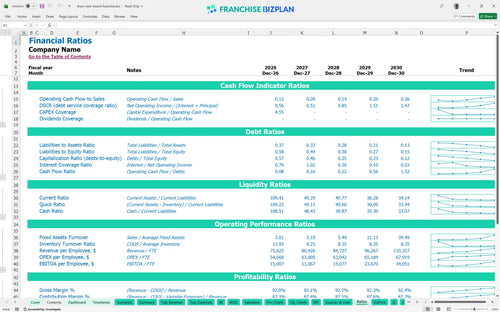
Performance metrics benchmark
We built this financial model using deep-dive research into the mobile service sector to ensure your projections are grounded in reality. Estimating annual revenue for home service franchises is easier with our pre-populated data, which shows a Year 1 revenue target of $303,000 and scales to over $717,000 by Year 5. You can adjust every lever, from technician wages to fuel percentages, to see how local market conditions impact your store-level EBITDA.
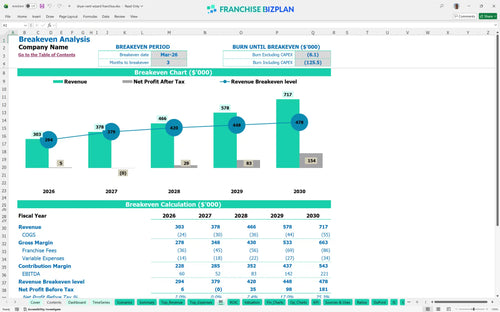
Your franchise profitability analysis shows a quick path to operational success, with the unit reaching breakeven in just 3 months by March 2026. While Year 1 EBITDA starts at $60,000, keep an eye on Year 2 where margins tighten slightly before scaling to a robust $221,000 in Year 5. This trajectory assumes you manage the 10% royalty and 2% marketing fee while scaling your technician headcount effectively.
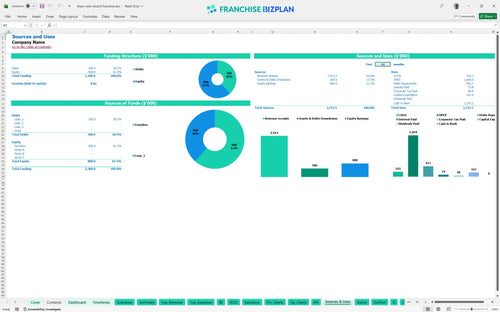
Based on the franchise investment disclosure data, you need approximately $167,400 to get your first territory off the ground. This covers your $49,900 franchise fee and the $60,000 needed for a branded service van, which acts as your primary marketing tool. Most of your capital goes into high-visibility assets and specialized diagnostic equipment that drive the white-glove service standard.
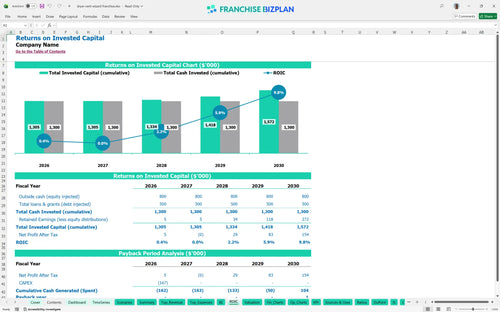
The ROI assessment for residential cleaning franchise models indicates a 5-year payback period with an Internal Rate of Return (IRR) of 2.7%. While the initial cash-on-cash return might seem modest, the Return on Equity (ROE) of 0.34 shows steady value building as the unit matures. Your franchise ROI calculation depends heavily on hitting the Year 5 revenue target of $717,000 to maximize the exit multiple.
Using this Excel template for franchise unit financial projections, we see the unit breaks even in March 2026, just three months after launch. The primary driver for reaching this point is service volume; you need to move past the initial $140,000 cleaning revenue floor quickly. Because fixed costs like the $1,000 home office rent are low, your ability to cover the 10% royalty and technician wages determines your monthly survival.
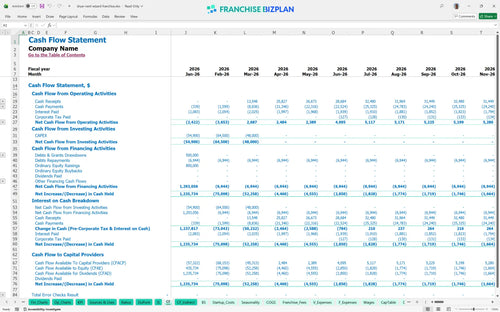
Your franchise unit cash flow management spreadsheet identifies the lowest cash point occurring in December 2028, with a minimum cash balance of $1,017. This suggests that while the unit is profitable early, the ramp-up of service technicians and administrative staff in years 3 and 4 puts pressure on liquidity. Best practices for franchise unit budget forecasting suggest keeping an extra $10,000 to $15,000 in reserve to handle these timing gaps.
A franchise financial feasibility study guide defintely needs to account for market volatility, as a 10% drop in revenue can delay your payback period by over a year. In the High scenario, aggressive local marketing could push Year 5 revenue well beyond $717,000, significantly increasing your IRR. The Medium case is your baseline, but the Low case highlights how sensitive the model is to technician labor costs and fuel price spikes.
This franchise financial model template is built in Excel to give you total control over your numbers. You can swap out pre-filled formulas and edit assumptions to match your specific territory, whether you are looking at a single van or a multi-unit expansion. It is a flexible tool that turns complex math into a clear roadmap for your service business.

Planning for the long haul requires more than just a gut feeling; you need a small business financial projection that looks five years into the future. This model tracks revenue, costs, and cash flow to show you how your bottom line evolves as you scale from one technician to a full crew. Using this franchise business plan template helps you spot potential cash crunches before they happen.

Royalties and marketing funds are the franchise tax that can eat your margin if you aren't careful. This model simplifies operating expense forecasting by automating these calculations based on your gross sales. Analyzing royalty and marketing fees in franchise models is essential to ensure your local overhead doesn't outpace your ability to pay the franchisor and yourself.

Knowing how to calculate startup costs for a franchise is the first step to avoiding a failed launch. This franchise startup cost calculator aggregates everything from your initial fee to your branded van and diagnostic tools. We include capital expenditure planning to help you identify the exact sales volume needed to cover your fixed costs and start generating real cash.

Don't guess on your margins when you can use unit economic modeling based on real-world service standards. The template includes benchmarks for fuel, supplies, and how to project labor costs for a mobile franchise so your assumptions stay grounded in reality. Comparing your projected technician productivity against industry norms ensures your plan is actually achievable in the field.


Simply purchase and download the financial model template, then access it instantly using Microsoft Excel or Google Sheets. No installation or technical expertise required-just open and start working.

Enter your business-specific numbers, including revenue projections, costs, and investment details. The pre-built formulas will automatically calculate financial insights, saving you time and effort.

Leverage the investor-ready format to confidently showcase your financial projections to banks, franchise representatives, or investors. Impress stakeholders with clear, data-driven insights and professional reports.

Leverage the investor-ready format to confidently present your projections to banks, franchise representatives, or investors.