
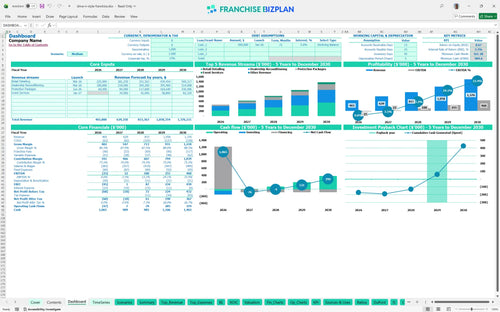
All-in-one Dashboard
Core inputs and core outputs


This franchise unit financial forecasting spreadsheet includes a comprehensive investment calculator, multi-year revenue projections, and a detailed startup budget for a mobile reconditioning business.
Core inputs and core outputs
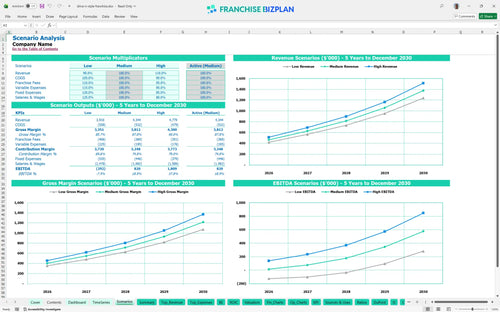
Three scenario analysis
Presentation ready
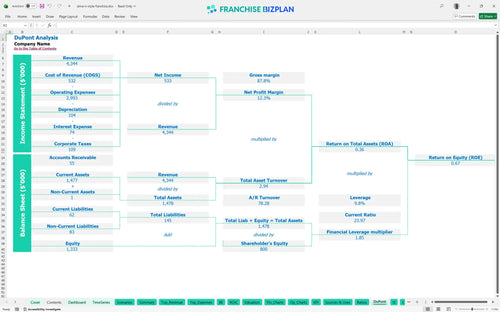
DuPont analysis
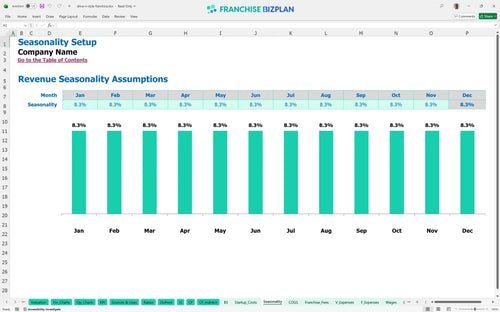
Researched revenue assumptions
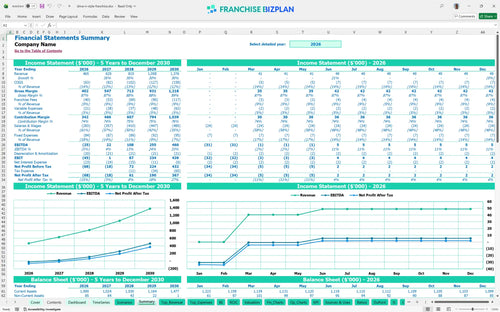
Lender-friendly financial outputs
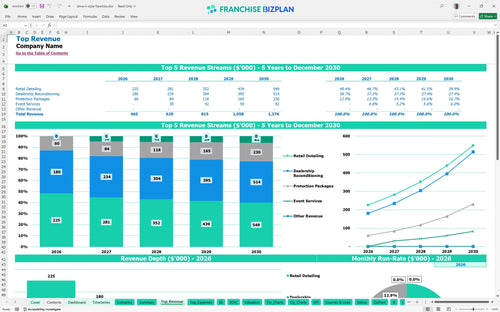
Revenue stream detailed view
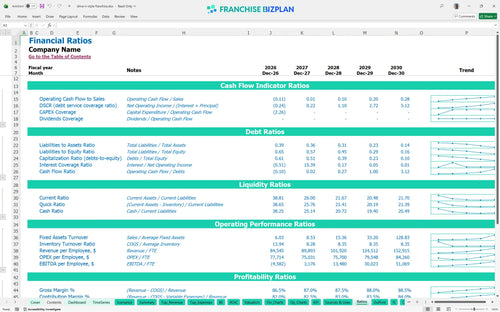
Performance metrics benchmark
We built this franchise unit financial model using our own research to provide a data-driven mobile detailing franchise business plan. Key assumptions, including the $45,000 franchise fee and the 7.5% royalty, are pre-populated and fully editable to match your specific market. The model tracks diverse revenue streams like retail detailing and dealership reconditioning, showing a path from a $25,000 year-1 EBITDA loss to a $460,000 profit by year 5.
The franchise unit reaches positive EBITDA of $22,000 in year 2 and scales rapidly to $460,000 by year 5. Profitability is driven by increasing the technician team to 8 FTEs and reducing restoration supply costs from 10% to 8% as you gain scale. Here's the quick math: your year-5 EBITDA margin hits 33% as fixed costs like the $2,800 mobile unit lease are spread over a much larger revenue base.
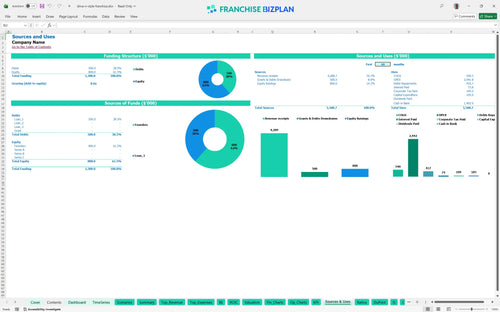
You need approximately $105,000 in initial CAPEX to launch this mobile auto restoration business model, plus working capital to cover the 7-month ramp-up. The largest upfront costs are the $45,000 franchise fee and the $35,000 mobile reconditioning unit. This estimate hides the timing of the $5,000 initial inventory spend, which must be ready before the March 2026 launch date.
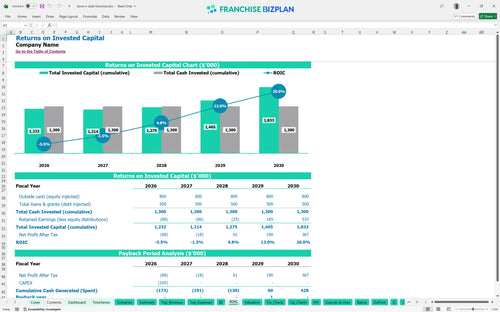
The model projects a 4-year payback period with an internal rate of return (IRR) of 3.35% and a return on equity (ROE) of 0.67. While the early years focus on debt service and team building, the year-5 revenue of $1,376,000 demonstrates the high ceiling for a well-run mobile territory. Your profit margin analysis for luxury automotive detailing franchise services shows that mature-unit performance is where the real value is unlocked.
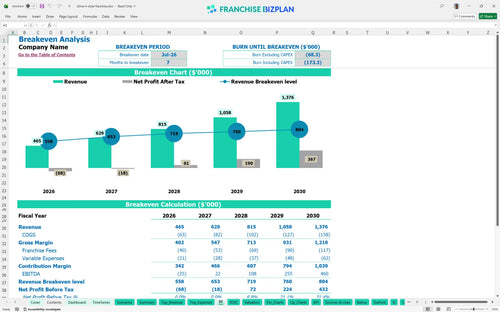
The franchise unit hits the monthly break-even point in July 2026, just 7 months after starting operations. To cover the $7,000 monthly fixed cost base-including insurance and storage-you need to maintain steady volume in the B2B automotive service revenue segment. Break-even depends less on retail one-offs and more on the recurring $10,000+ monthly dealership reconditioning contracts.
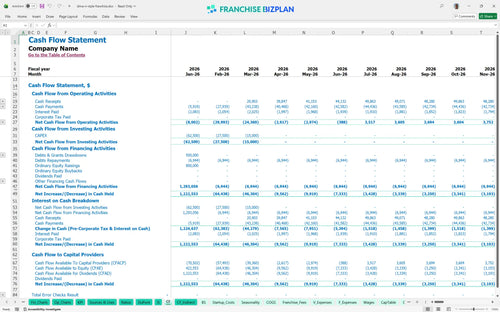
The lowest cash point is projected at $985,000 in October 2028, indicating that the initial investment and early cash flow provide a very deep runway. Still, you must manage the timing gaps between dealership net-30 payments and your weekly payroll for the operations manager and technicians. If opening takes 90+ days longer than planned, working capital pressure rises, but the current model shows significant liquidity.
The model allows you to test how a 15% drop in retail detailing volume affects your year-1 EBITDA, which currently sits at a $25,000 loss. In a high-growth scenario, hitting the $1.3M revenue mark defintely requires scaling to 4 certified technicians by year 5. Scenarios show that even in a low-volume environment, the 8.5% total franchise fee burden remains manageable if you maintain a $55+ average ticket.
Finance: update unit break-even and payback model by Friday
This franchise financial model template is built in Excel with fully editable assumptions and pre-filled formulas, allowing you to adapt the numbers to your specific territory. You can adjust the mobile detailing franchise business plan drivers to reflect local labor rates, fuel costs, and specific dealership contract terms without breaking the logic. It is designed to be a living document that evolves from your initial research into an active tool for managing unit performance.

The model provides a detailed roadmap from your first mobile unit to a mature operation, covering five years of revenue, expenses, and cash flow. By forecasting growth across retail detailing and dealership reconditioning segments, you can visualize how the business scales from $465,000 in year 1 to over $1.3 million by year 5. This long-term view is essential for estimating ROI for mobile car restoration franchise units and planning for future equipment upgrades.

Managing the franchise royalty structure is simplified with dedicated inputs for the 7.5% royalty and 1% brand marketing fund contributions. The model automatically calculates these fees against your monthly revenue projections, ensuring you understand the exact impact on your store-level margin. This transparency helps you plan for the $45,000 initial franchise fee and ongoing obligations while maintaining a healthy bottom line.

This tool provides a detailed startup budget breakdown for mobile reconditioning business operations, covering everything from the $35,000 mobile unit to specialized tools. It calculates the specific sales volume needed to cover your $7,000 monthly fixed costs, including the mobile unit lease and storage rent. Knowing your break-even point helps you manage cash runway during the critical first seven months of the ramp-up phase.

The model incorporates researched benchmarks for automotive franchise startup costs and operating margins to help you sanity-check your projections. You can compare your restoration supply costs, which start at 10% of revenue, against industry standards to ensure your unit is operating efficiently. These benchmarks act as a guardrail, helping you identify if your labor costs or chemical waste are trending out of alignment with successful units.


Simply purchase and download the financial model template, then access it instantly using Microsoft Excel or Google Sheets. No installation or technical expertise required-just open and start working.

Enter your business-specific numbers, including revenue projections, costs, and investment details. The pre-built formulas will automatically calculate financial insights, saving you time and effort.

Leverage the investor-ready format to confidently showcase your financial projections to banks, franchise representatives, or investors. Impress stakeholders with clear, data-driven insights and professional reports.

Leverage the investor-ready format to confidently present your projections to banks, franchise representatives, or investors.