
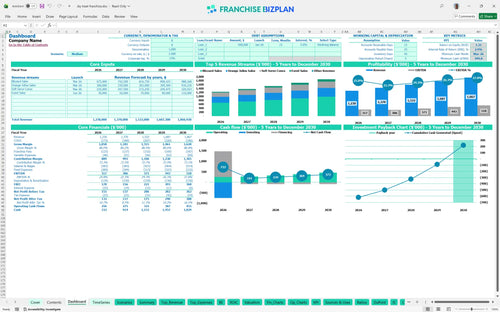
All-in-one Dashboard
Core inputs and core outputs


This franchise unit financial projection template excel includes everything from a franchise investment excel spreadsheet to multi-year P&L statements for a complete investment view.
Core inputs and core outputs
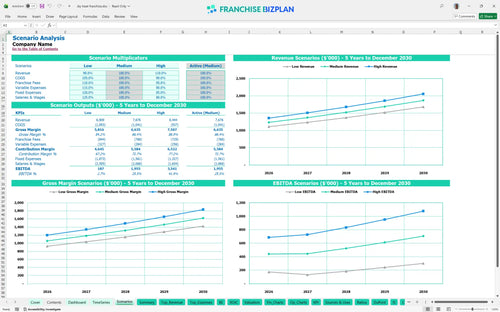
Three scenario analysis
Presentation ready
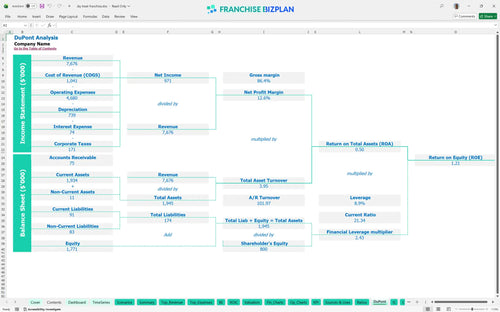
DuPont analysis
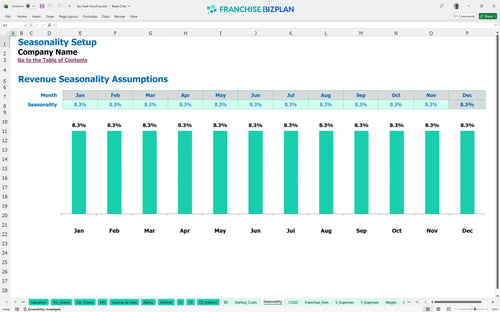
Researched revenue assumptions
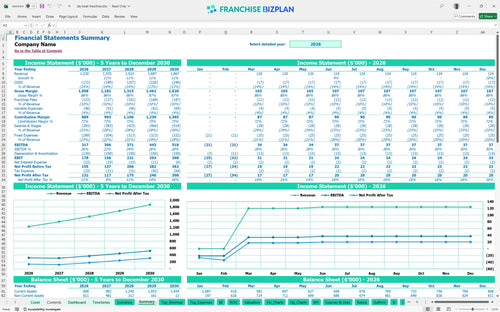
Lender-friendly financial outputs
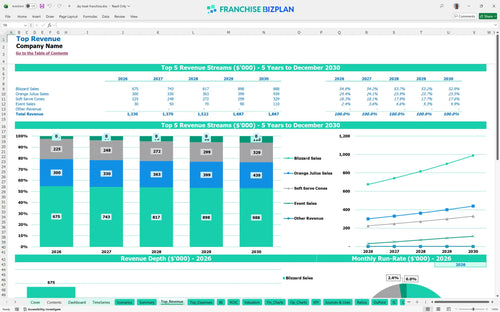
Revenue stream detailed view
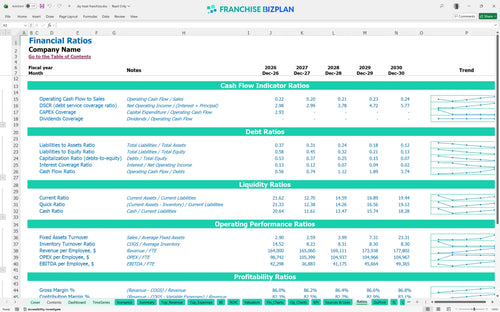
Performance metrics benchmark
We built this franchise unit financial model using our own research into high-traffic treat concepts. Key assumptions like the $25,200 initial fee, 5% royalty, and Year 1 revenue of $1,230,000 are pre-populated and ready for your specific site analysis. This tool helps you bridge the gap between a brand's high-level estimates and your actual store-level reality.
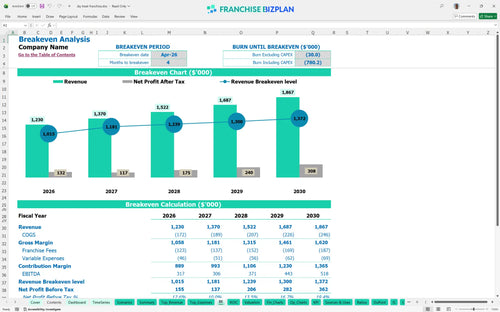
The unit hits its break-even point by April 2026, just four months after the March launch. By Year 3, the restaurant franchise profitability calculator estimates an EBITDA of $371,000 after accounting for the 10% total brand fees and $18,000 monthly rent. Consistent traffic is the engine that drives this trajectory.
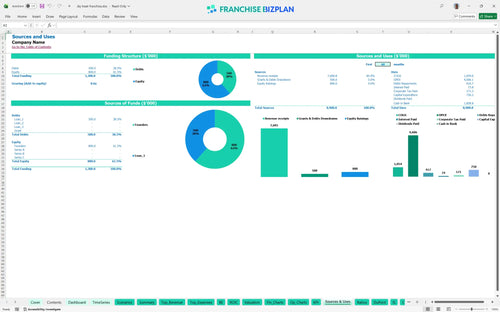
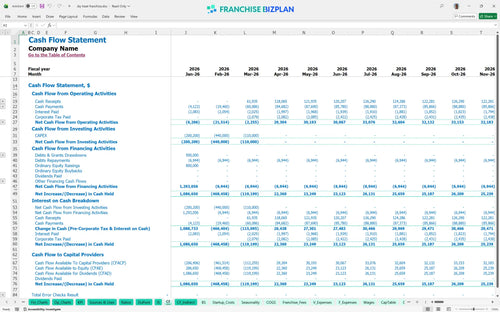
You will need significant liquidity, as the minimum cash hits $499,000 in March 2026. This capital expenditure budget template covers the $350,000 build-out, $120,000 for soft serve machines, and the initial franchise fee to get the doors open. Having a clear view of your sources and uses prevents mid-construction funding gaps.
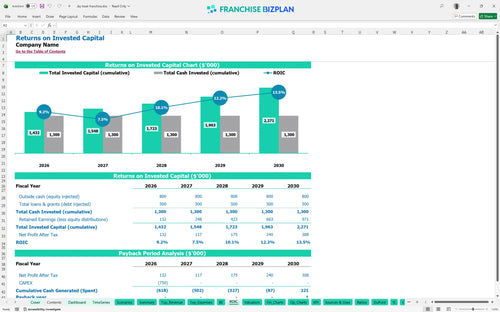
Estimating roi for a new franchise store shows a 5-year payback period and an internal rate of return (IRR) of 2.89%. While evaluating franchise investment opportunities for beginners, this return on investment projection highlights that long-term value is driven by the steady climb in annual revenue toward $1.86M. It is a marathon, not a sprint.
The unit reaches break-even in April 2026, requiring about 4 months of trading to cover the fixed overhead. Rent at $18,000 and the 10% combined royalty and marketing fees are the biggest hurdles to clear each month in your franchise unit operating budget template. High throughput in the early months is essential.
Your lowest cash point is $499,000 in March 2026, right as operations commence. You defintely need to maintain a strict buffer during the first 90 days of the build-out to handle the $350,000 in leasehold improvements without stalling. Cash management during the ramp-up phase determines your ultimate survival.
Financial modeling for new franchise locations requires looking at Low, Medium, and High cases. Using a franchise financial performance representation template, you can see that a 10% drop in revenue significantly delays the 5-year payback, while hitting the High case through event sales could push Year 5 EBITDA well past $518,000. Scenarios help you prepare for the unexpected.
This food service franchise financial model excel is built to give you total control over your unit-level projections. You can adjust every assumption from product mix to hourly wages, ensuring the numbers reflect your specific territory and local labor market. It is a flexible tool that handles the heavy lifting of complex math so you can focus on the strategy of your rollout.

Planning for the long haul is critical, especially when Year 1 revenue starts at $1,230,000 and scales to $1,867,000 by Year 5. This franchise business plan template provides a clear roadmap for growth by including operational expense forecasting and how to forecast revenue for a retail franchise. You can track how EBITDA expands from $317,000 to over $518,000 as the location matures and gains local density.

Managing the franchise royalty fee structure is a non-negotiable part of your monthly cash flow. This model accounts for a 5% royalty and a 5% marketing fee, ensuring you see exactly how much goes to the brand before you cover your $18,000 monthly rent. It simplifies the math of ongoing obligations so you can see the true store-level margin after all brand-related costs.

Use the franchise startup cost calculator to map out your $350,000 leasehold improvements and $120,000 equipment package. Knowing your break-even analysis for restaurants is vital, and this model shows you how to calculate startup costs for a food franchise while identifying the exact sales volume needed to cover your fixed costs. Speed to profit is the goal here.

We include benchmarks for dairy mix ingredients and packaging to ensure your franchise profitability analysis stays grounded in reality. Comparing your projected 12% ingredient cost against industry standards helps you spot margin leaks before they impact your bottom line. It is a sanity check that keeps your projections realistic and defensible for lenders or partners.


Simply purchase and download the financial model template, then access it instantly using Microsoft Excel or Google Sheets. No installation or technical expertise required-just open and start working.

Enter your business-specific numbers, including revenue projections, costs, and investment details. The pre-built formulas will automatically calculate financial insights, saving you time and effort.

Leverage the investor-ready format to confidently showcase your financial projections to banks, franchise representatives, or investors. Impress stakeholders with clear, data-driven insights and professional reports.

Leverage the investor-ready format to confidently present your projections to banks, franchise representatives, or investors.