
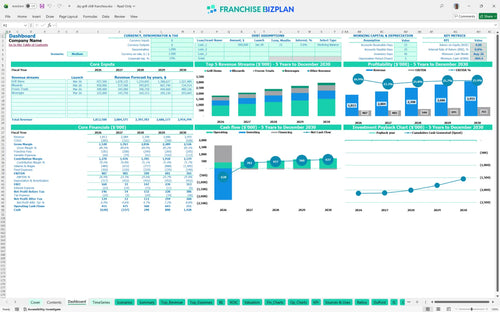
All-in-one Dashboard
Core inputs and core outputs


This comprehensive financial tool includes pre-configured revenue streams, detailed CapEx schedules, and dynamic 5-year pro formas designed specifically for high-volume quick-service operations.
Core inputs and core outputs
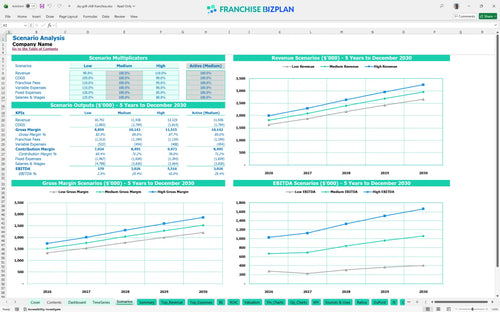
Three scenario analysis
Presentation ready
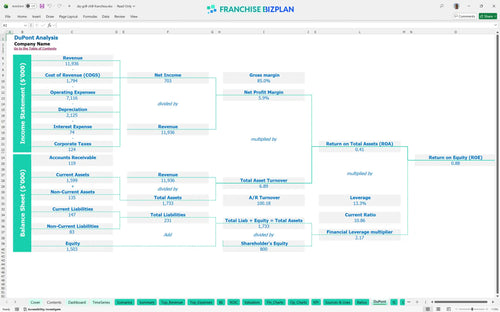
DuPont analysis
Researched revenue assumptions
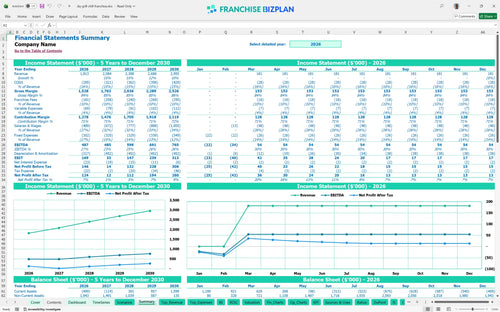
Lender-friendly financial outputs
Revenue stream detailed view
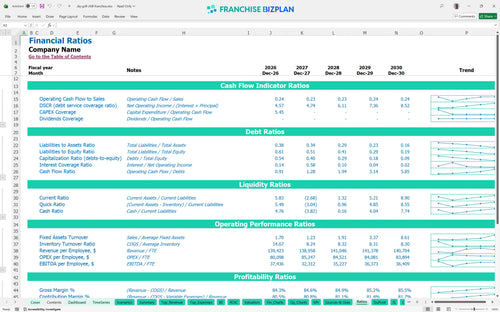
Performance metrics benchmark
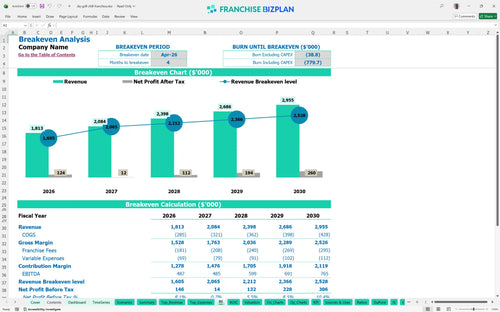
Financial forecasting for new fast food franchise locations shows this unit hits its stride almost immediately, reaching breakeven by April 2026. With a year-one EBITDA of $487,000, the model demonstrates that strong grill and treat sales can offset the 10% combined royalty and marketing burden. You are looking at a profitable operation within the first four months of opening your doors.
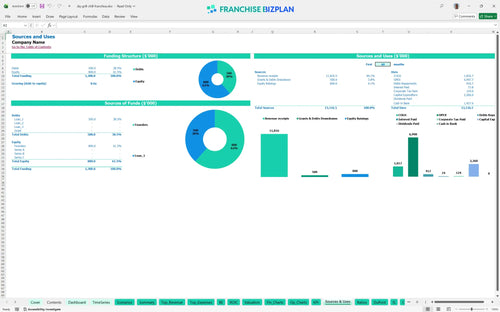
Launching this unit requires a total capital expenditure planning effort of approximately $2,260,000 to cover the high-end build-out and specialized equipment. This includes $850,000 for leasehold improvements and $420,000 for a dual-lane drive-thru, which is critical for projecting labor and food costs for restaurant franchises at high volumes. You also need to budget $280,000 specifically for soft-serve machines to secure your primary dessert revenue stream.
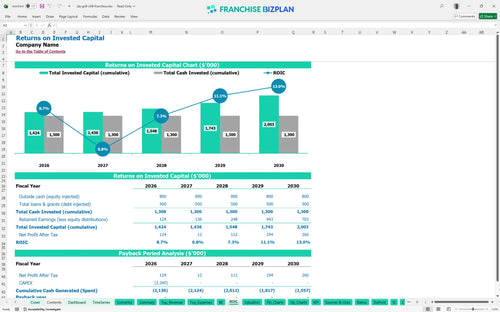
When evaluating franchise investment opportunities with financial models, the 76% Internal Rate of Return (IRR) stands out as a strong signal for multi-unit operators. While the return on investment analysis shows a payback period extending past year five due to the heavy $2.26M initial spend, the 88% Return on Equity (ROE) proves the long-term value. This is a marathon play where the mature-unit cash flow justifies the high entry price.
Unit economics forecasting indicates you only need four months to reach the point where revenue covers all monthly outlays, including the $18,000 prime location rent. Analyzing the break-even point for quick service restaurants shows that your $1,813,000 year-one sales target provides a healthy cushion above fixed costs. The biggest lever here is throughput; moving cars through that $420,000 drive-thru is what keeps the lights on.
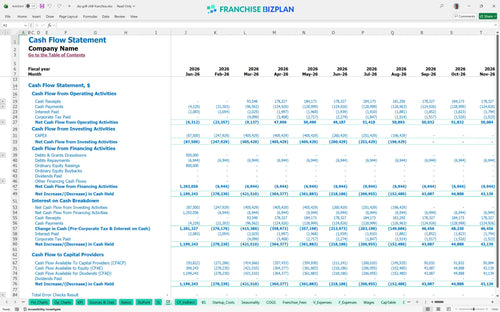
The franchise unit cash flow statement template identifies a significant cash dip, with the minimum cash point hitting negative $804,000 in August 2026. This happens because the heavy construction costs for the drive-thru and leaseholds hit before the revenue fully ramps up. You need a solid working capital buffer to navigate this eight-month window until the unit becomes self-sustaining.
Learning how to build a pro forma for a new franchise unit means testing what happens if sales don't hit the $1.8M mark in year one. A low-revenue scenario could delay your April 2026 breakeven and deepen the $804,000 cash hole, making labor productivity even more vital. Conversely, hitting the high-growth targets moves your year-five EBITDA well beyond the projected $765,000 through better fixed-cost absorption.
To move forward, you must validate these projections against your specific site's traffic counts and local contractor bids. The model is ready for your inputs, but the local reality on the ground will dictate your final margin. Still, having this data-driven baseline is the only way to talk to lenders or partners with actual confidence.
Finance: update unit break-even and payback model by Friday
This restaurant franchise financial model Excel template provides a fully editable environment to stress-test your assumptions before signing a lease. You can adjust pre-filled formulas for local labor rates and specific site costs, making it a versatile franchise financial model template for any territory. It defintely simplifies the math so you can focus on the actual operation rather than building spreadsheets from scratch.

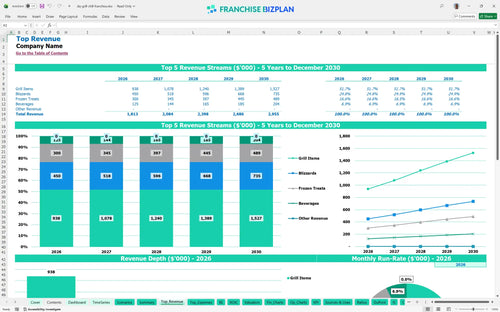
Planning for the long haul requires more than just a first-year guess, so we included a detailed QSR franchise investment analysis spanning sixty months. This restaurant business plan spreadsheet tracks your climb from $1,813,000 in year-one revenue to a projected $2,955,000 by year five. It provides a clear franchise unit profitability projection that maps out exactly how store-level margins evolve as your local customer base matures.

The model handles the heavy lifting of estimating royalty and advertising fund expenses for franchises by applying a 4% royalty and a 6% marketing fee directly to your gross sales. By referencing the standard franchise disclosure document terms, the tool ensures you never overlook the $45,000 initial fee or the ongoing brand contributions. It is about seeing the real cash left in your pocket after the franchisor takes their cut.

Understanding how to calculate startup costs for a restaurant franchise is the first step to avoiding a cash crunch. This fast food startup cost calculator aggregates your $850,000 leasehold improvements and $420,000 drive-thru construction to show the total mountain you need to climb. The model then performs an intensive analysis of the break-even point for quick service restaurants to show exactly when your daily traffic starts paying for itself.

We use best practices for restaurant franchise financial planning by including built-in targets for food and labor costs to keep your projections grounded. The operating expense breakdown includes a $18,000 monthly rent and $2,800 for utilities, allowing you to compare your specific site against standard industry performance. It is a reality check that helps you spot if your projected 13.5% food cost is too optimistic or right on the money.


Simply purchase and download the financial model template, then access it instantly using Microsoft Excel or Google Sheets. No installation or technical expertise required-just open and start working.

Enter your business-specific numbers, including revenue projections, costs, and investment details. The pre-built formulas will automatically calculate financial insights, saving you time and effort.

Leverage the investor-ready format to confidently showcase your financial projections to banks, franchise representatives, or investors. Impress stakeholders with clear, data-driven insights and professional reports.

Leverage the investor-ready format to confidently present your projections to banks, franchise representatives, or investors.