
All-in-one Dashboard
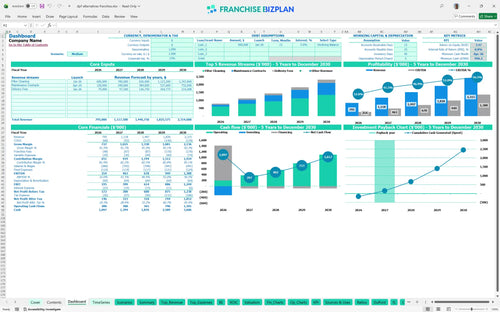
Core inputs and core outputs


This franchise unit financial model template provides a data-driven framework to forecast revenue from B2B fleet maintenance contracts and analyze the ROI of heavy-duty vehicle equipment investment.
Core inputs and core outputs
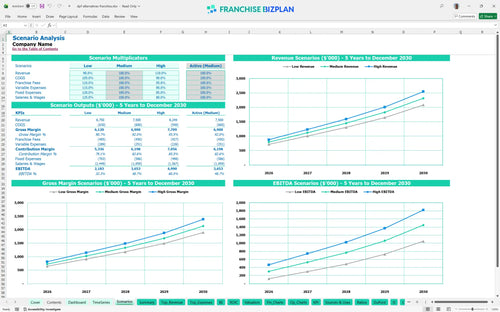
Three scenario analysis
Presentation ready
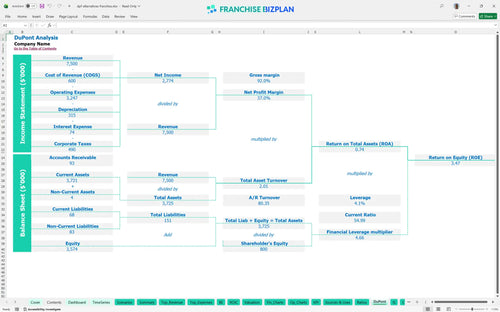
DuPont analysis
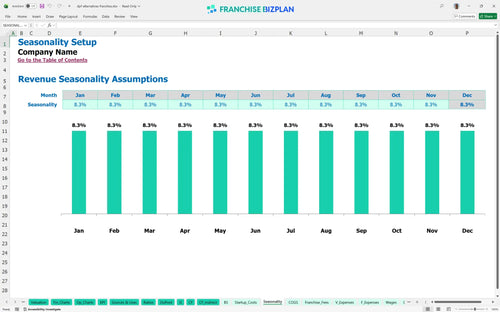
Researched revenue assumptions
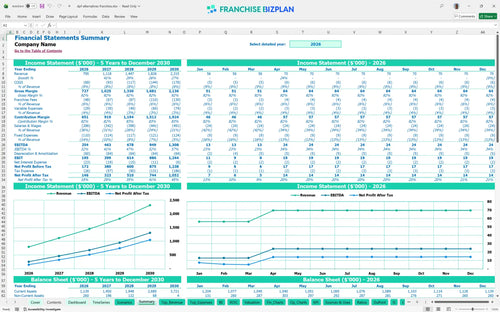
Lender-friendly financial outputs
Revenue stream detailed view
Performance metrics benchmark
We built this franchise unit financial model using our own research into the emissions system maintenance revenue landscape. Key assumptions, including the $125,000 ultrasonic cleaning system investment and 6% royalty fees, are pre-populated and fully editable. This tool defintely helps you map a path from the initial $2,500 franchise fee to a projected $1.3 million EBITDA by year five.
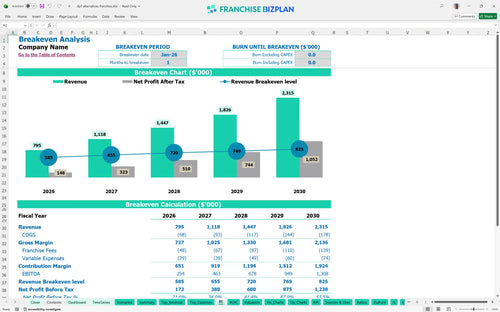
This franchise unit becomes profitable almost immediately, with a break-even date of January 2026. By year two, revenue is projected at $1,118,000, and because the 6% royalty is the primary ongoing franchise cost, net profit scales quickly as you move past the first month of operations.
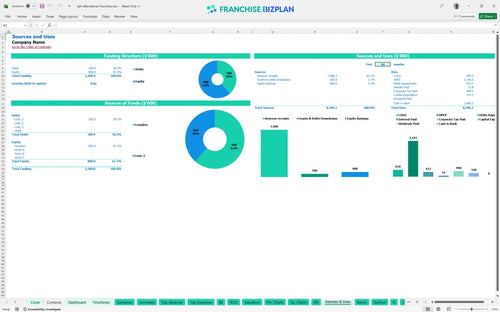
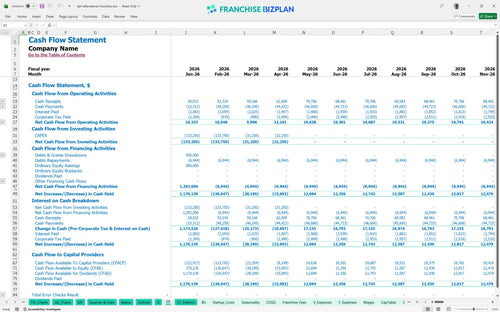
You need approximately $319,500 in upfront capital for equipment and build-out to launch this DPF cleaning business model in the US. The model shows a minimum cash requirement of $996,000 by April 2026, which includes your $50,000 mobile delivery van fleet and a healthy buffer for the initial ramp-up phase.
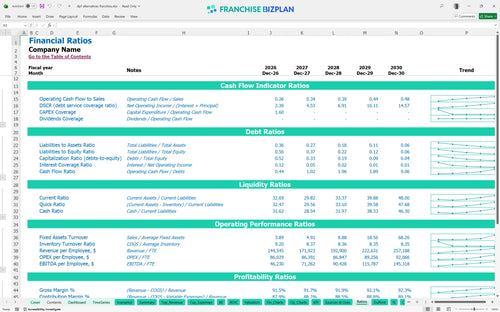
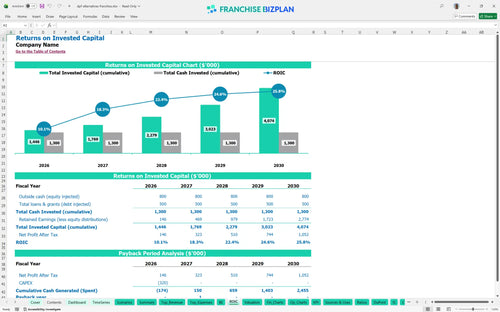
Investors can expect an Internal Rate of Return (IRR) of 8.78% and a Return on Equity (ROE) of 3.47% for this unit. The commercial fleet service ROI is supported by a 2-year payback period, meaning you recoup your initial heavy-duty vehicle equipment investment relatively quickly compared to other industrial service models.
The unit reaches its monthly break-even point in January 2026, just one month after launch. The key driver for this speed is the low $2,500 franchise fee and manageable $5,500 monthly rent, which allows the $400,000 in first-year filter cleaning revenue to cover fixed costs almost immediately.
The lowest cash balance occurs in April 2026 at $996,000, following the completion of facility improvements and equipment purchases. You need several months of runway to handle the $85,000 facility build-out, so staying disciplined with your $15,000 initial supply order is vital to protecting your liquidity.
Comparing Low vs High scenarios shows that hitting the high case through aggressive B2B sales can significantly shorten the 2-year payback period. While the medium case projects $795,000 in year-one revenue, the model allows you to see how a 10% shift in technician productivity or fuel costs impacts your peak cash need and year-1 margin.
This franchise unit financial model is fully customizable in Excel, with pre-filled formulas and editable assumptions that make it easy to adapt to a specific franchise concept, location, and operating scenario. You can adjust the $5,500 monthly rent or modify the technician headcount as your local demand grows, ensuring the model reflects your specific territory. It is a flexible tool for managing franchise operating expenses without needing to build a spreadsheet from scratch.

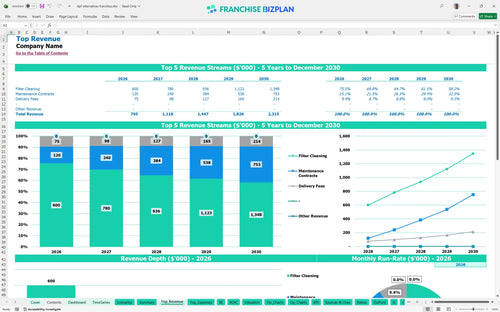
Planning for the long term requires a detailed 5-year view of your revenue, cost, cash flow, and profit projections tailored for a franchise unit. This fleet maintenance business plan tracks your growth from $795,000 in year one to over $2.3 million by year five, providing a clear roadmap for scaling. A deep franchise unit profitability analysis helps you visualize how margins expand as you move past the initial ramp-up phase.

The model captures franchise-specific financial obligations, including upfront franchise fees, royalty payments, and brand marketing fund contributions, so buyers can understand the real economics of operating the unit. With a 6% royalty fee integrated into the monthly cash flow, you can see exactly how these payments impact your store-level EBITDA. This ensures you are never surprised by the cost of brand standards and ongoing support.

Startup cost planning is critical for estimating the total initial investment, monthly cost structure, and the sales level required to cover fixed and variable costs. This tool helps you map out the $319,500 needed for equipment and facility improvements while identifying the exact month you stop burning cash. Knowing your break-even point allows you to manage your initial $15,000 supply order with much more confidence.

The model incorporates built-in franchise and industry benchmarks for key operating and financial metrics, helping users sanity-check assumptions against typical ranges. You can compare your $68,000 manager salary or 7% chemical costs against standard automotive franchise startup costs. This feature is essential for an industrial cleaning franchise investment where equipment and specialized labor costs must stay within profitable limits.


Simply purchase and download the financial model template, then access it instantly using Microsoft Excel or Google Sheets. No installation or technical expertise required-just open and start working.

Enter your business-specific numbers, including revenue projections, costs, and investment details. The pre-built formulas will automatically calculate financial insights, saving you time and effort.

Leverage the investor-ready format to confidently showcase your financial projections to banks, franchise representatives, or investors. Impress stakeholders with clear, data-driven insights and professional reports.

Leverage the investor-ready format to confidently present your projections to banks, franchise representatives, or investors.