
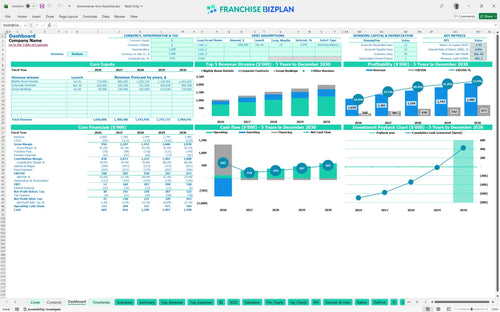
All-in-one Dashboard
Core inputs and core outputs


The franchise unit financial model template includes a comprehensive dashboard, detailed revenue logs, CAPEX schedules, and full 5-year financial statements.
Core inputs and core outputs
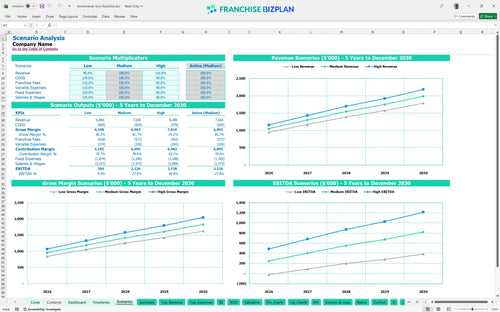
Three scenario analysis
Presentation ready
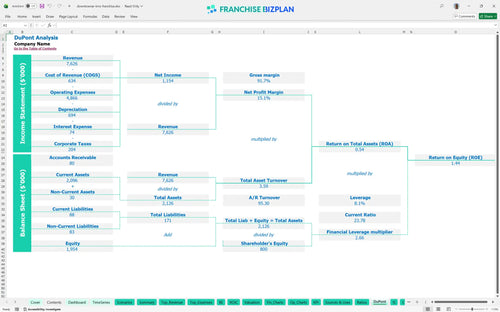
DuPont analysis
Researched revenue assumptions
Lender-friendly financial outputs
Revenue stream detailed view
Performance metrics benchmark
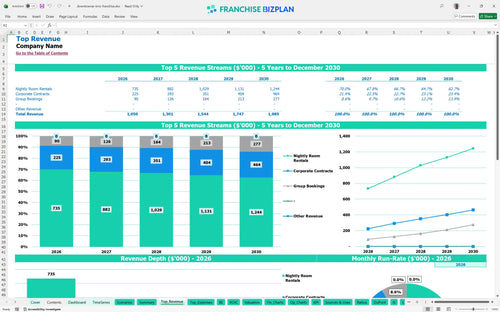
We developed this hospitality unit financial model using deep industry research to ensure every line item reflects real-world operations. Key assumptions for revenue streams, like the $1,050,000 Year 1 target, and EBITDA projections of $168,000 are pre-populated and fully adjustable to match your specific territory. This data-driven approach gives you a credible starting point for your feasibility study.
The unit is projected to reach profitability by Year 1 with an EBITDA of $168,000, which scales significantly to $673,000 by Year 5 as revenue grows. This hotel franchise profitability calculator accounts for all royalties and the 2.5% marketing fee to show true net earnings. Speed to profit is the only metric that keeps the lights on.
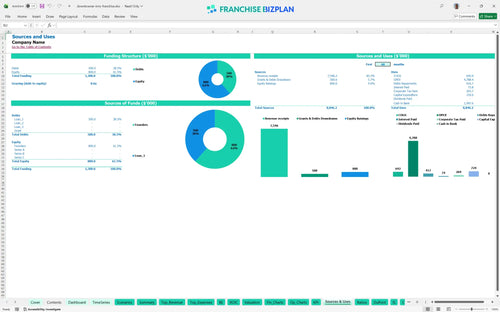
To launch this unit in the US, you need to account for $724,000 in total capital expenditure, including a $6,000 franchise fee and $420,000 for renovations. Understanding how to calculate startup costs for a hotel franchise is vital for securing financing and managing your opening cash buffer. Build-out costs are where most rookies lose their shirt.
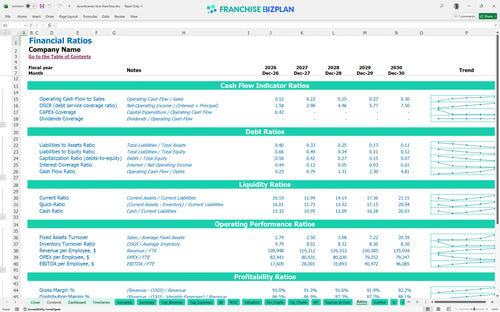
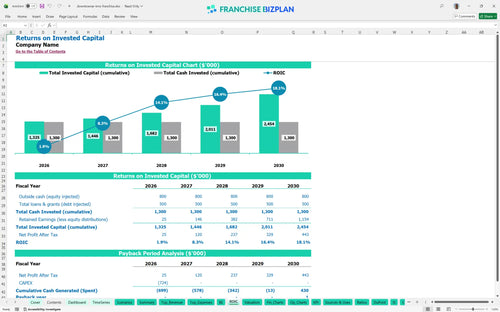
Investors can expect a 5-year payback period with an Internal Rate of Return (IRR) of 2.85% and a Return on Equity (ROE) of 1.44. Estimating ROI for hospitality franchise investment requires looking past top-line revenue to the $673,000 Year 5 EBITDA. ROI is the ultimate scorecard for any operator.
The unit hits its monthly break-even point in July 2026, exactly 7 months after starting operations, provided you manage the $13,500 monthly rent. This financial model template for budget hotel franchise operations identifies labor and rent as the primary hurdles to reaching positive cash flow. Volume is vanity, but break-even is sanity.
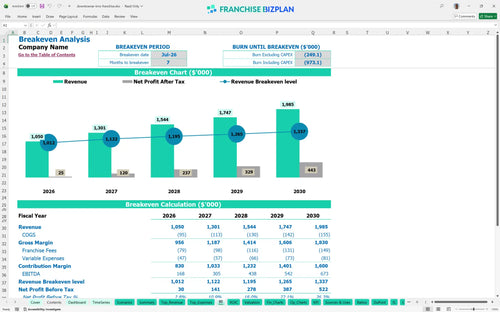
Your lowest cash point is projected at $285,000 in June 2026, which means you defintely need a solid working capital reserve before the July break-even. This monthly operational budget for hotel franchise unit planning ensures you don't run out of fuel during the critical ramp-up phase. A cash buffer is your best insurance policy.
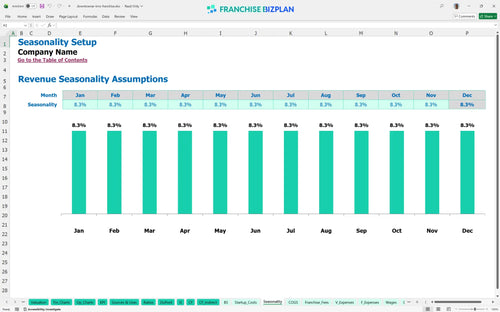
The model allows you to toggle between scenarios to see how a 10% drop in nightly room rentals affects your Year 1 $1,050,000 revenue target. This Excel financial projection model for new hotel owners demonstrates that even small shifts in OTA commissions or utilities can delay your 5-year payback. Strategy is just a guess until you stress-test the numbers.
This franchise financial model template provides a professional-grade Excel environment where every formula is open and every assumption is editable. You can adjust room counts, seasonal pricing, and local labor rates to see how they impact your bottom line in real-time. Your model should be a tool, not a static document.

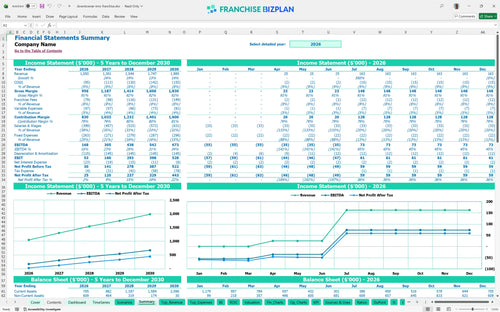
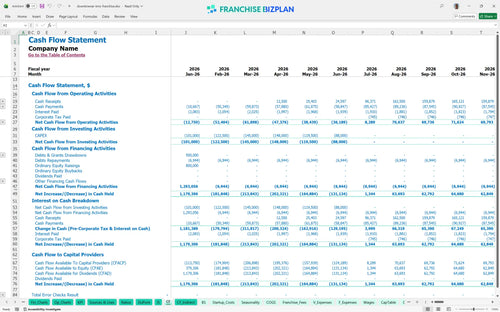
Planning for the long term is essential when navigating the hospitality industry, and this franchise business plan Excel tool delivers detailed 5-year projections. It maps out your path from the initial opening to a mature, stabilized asset, covering revenue, expenses, and net cash flow. Long-term vision requires short-term precision.

The model simplifies complex franchise royalty fee structure obligations by automating the math for a 5% royalty and a 2.5% marketing fund contribution. By baking these brand-level costs directly into your monthly projections, you get a transparent view of your true store-level margin. Royalties are the price of brand power.

Launching a unit requires a clear understanding of hotel franchise startup costs, from the $6,000 initial fee to the $420,000 leasehold improvements. This model helps you identify the exact sales volume needed to cover your $13,500 monthly rent and other fixed overhead. Cash is king, but break-even is the kingdom.

We integrate hotel occupancy rate projections and standard hospitality margins to help you verify if your pro forma numbers are realistic. Comparing your projected housekeeping supply costs, which start at 6.8% of revenue, against industry norms ensures your plan stands up to lender scrutiny. Benchmarks keep your ego in check.


Simply purchase and download the financial model template, then access it instantly using Microsoft Excel or Google Sheets. No installation or technical expertise required-just open and start working.

Enter your business-specific numbers, including revenue projections, costs, and investment details. The pre-built formulas will automatically calculate financial insights, saving you time and effort.

Leverage the investor-ready format to confidently showcase your financial projections to banks, franchise representatives, or investors. Impress stakeholders with clear, data-driven insights and professional reports.

Leverage the investor-ready format to confidently present your projections to banks, franchise representatives, or investors.