
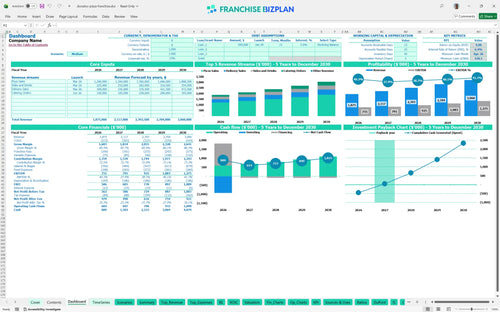
All-in-one Dashboard
Core inputs and core outputs


This comprehensive franchise unit financial model template provides a detailed Excel-based framework for projecting the performance of a high-volume pizza restaurant.
Core inputs and core outputs
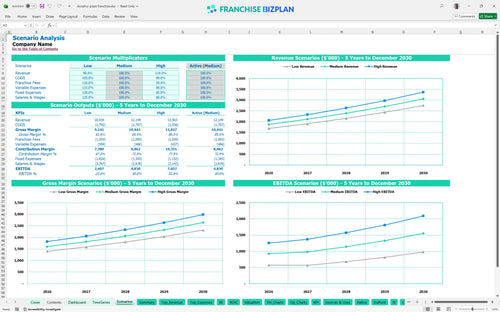
Three scenario analysis
Presentation ready
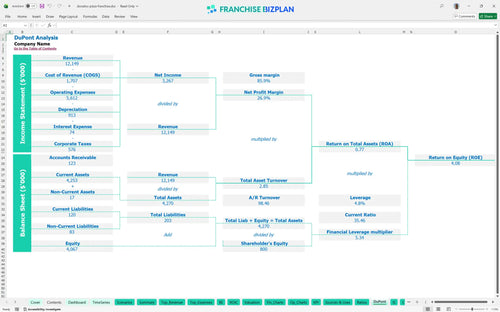
DuPont analysis
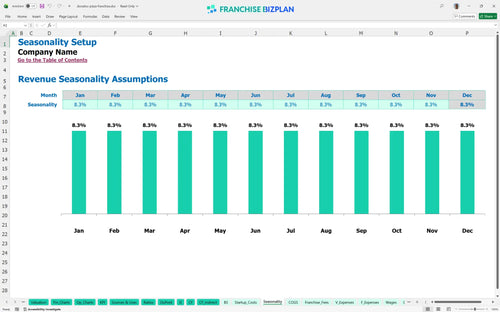
Researched revenue assumptions
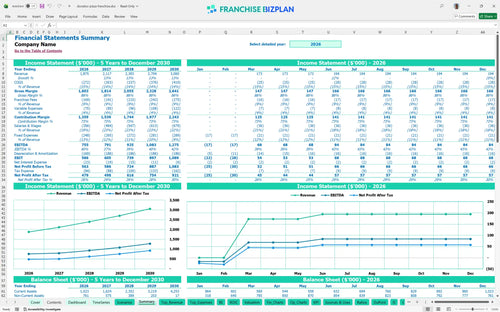
Lender-friendly financial outputs
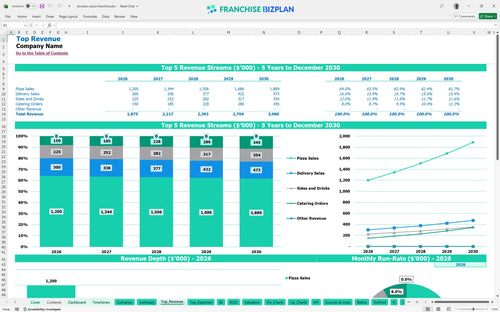
Revenue stream detailed view
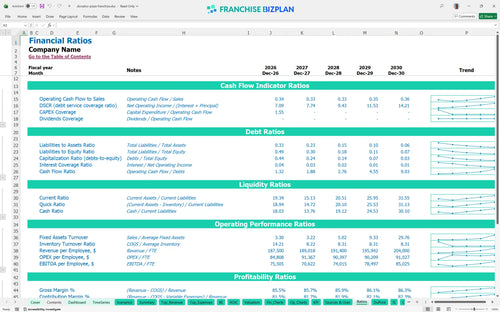
Performance metrics benchmark
We developed this financial model for a pizza franchise unit based on detailed market research and real-world operational data. The tool includes pre-filled assumptions for $1.87M in initial revenue, 4% royalties, and $930,000 in startup costs, all of which are fully customizable to your specific location. This is your roadmap to unit ownership.
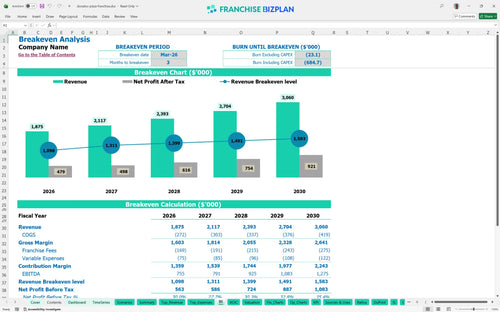
This pizza franchise unit is projected to reach profitability defintely within its first year, with a break-even date of March 2026. After accounting for 12.5% food costs and a combined 9% royalty and marketing burden, the model shows a strong year-one EBITDA of $755,000. Speed to profit is the primary goal here.
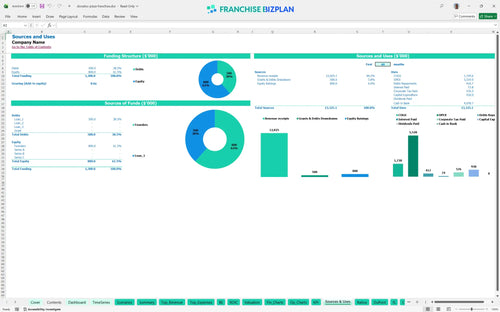
Launching this unit requires a total initial investment of $930,000, which covers the $30,000 franchise fee and $400,000 in leasehold improvements. This figure also includes $220,000 for specialized ovens and $40,000 for predictive kitchen technology. Capital goes into the kitchen first.
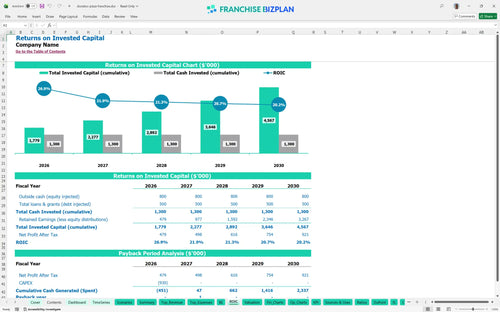
Investors can expect an Internal Rate of Return (IRR) of 6.4% and a Return on Equity (ROE) of 4.08% based on the five-year forecast. The payback period is relatively quick at 2 years, assuming the unit hits the projected $2.1M revenue mark by the second year. Two years to get your cash back is a strong benchmark.
The unit reaches its break-even point in just 3 months, requiring enough volume to cover $15,000 in monthly rent and $21,400 in other fixed operating costs. Throughput at the pick-up window is the primary driver for hitting these numbers early. Volume solves all problems in the pizza business.
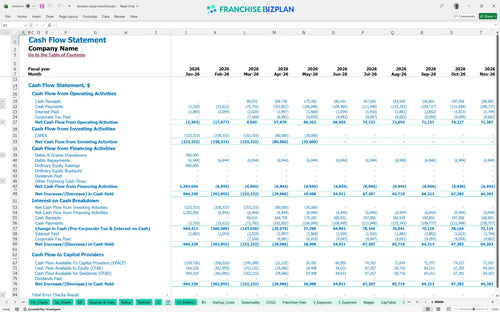
The lowest cash point occurs in April 2026 at $420,000, meaning you need a solid working capital buffer to handle the initial ramp-up. We recommend keeping at least four months of fixed expenses in reserve to manage the gap between opening and peak catering demand. Cash is king during the first six months.
Comparing scenarios shows that a High-growth case, driven by strong corporate catering, significantly pulls forward the 2-year payback period. The model allows you to toggle revenue and COGS percentages to see how a 5% shift in food costs impacts the $1.27M year-five EBITDA target. Scenarios help you plan for the worst while aiming for the best.
This pizza franchise financial model is built entirely in Excel, giving you total control over every variable from ingredient costs to local labor rates. The template features pre-filled formulas and editable assumptions, making it easy to perform a franchise unit profitability analysis that reflects your specific market conditions and territory. Customization is the key to accuracy when you are planning a high-volume food service operation.

The model provides detailed pizza restaurant financial projections across a sixty-month timeline to help you visualize long-term growth and cash flow. By using this restaurant business plan spreadsheet, you can track how revenue forecasting for different streams like catering and delivery impacts your bottom line as the unit matures. Five years of data gives you the full picture of your investment's potential.

This franchise business plan financial spreadsheet specifically tracks your ongoing obligations to the brand, including the 4% royalty and 5% marketing fund contributions. It accounts for the initial $30,000 franchise fee and ensures these costs are baked into your store-level margin calculations so there are no surprises. Royalties are a fact of life in franchising, so we make them easy to track.

Use this franchise startup costs template to map out your total initial investment, including leasehold improvements and specialized kitchen equipment. The integrated break-even analysis identifies exactly when your monthly sales will cover both fixed rent and variable labor costs, helping you manage the critical early months of operation. Know your numbers before you sign the lease.

Our model incorporates unit economics and operating expenses based on pizza industry standards to help you sanity-check your projections. You can compare your expected labor costs and gross margins against typical ranges using this pizza restaurant operating cost calculator to ensure your plan is realistic. Benchmarks keep your projections grounded in reality and help you spot margin leaks early.


Simply purchase and download the financial model template, then access it instantly using Microsoft Excel or Google Sheets. No installation or technical expertise required-just open and start working.

Enter your business-specific numbers, including revenue projections, costs, and investment details. The pre-built formulas will automatically calculate financial insights, saving you time and effort.

Leverage the investor-ready format to confidently showcase your financial projections to banks, franchise representatives, or investors. Impress stakeholders with clear, data-driven insights and professional reports.

Leverage the investor-ready format to confidently present your projections to banks, franchise representatives, or investors.