
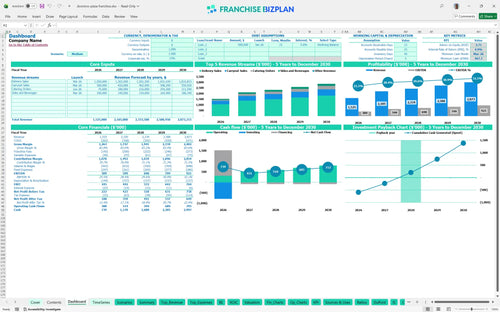
All-in-one Dashboard
Core inputs and core outputs


This unit economics calculator and Excel template for pizza franchise startup costs includes a full suite of pro-forma statements, CAPEX schedules, and interactive assumptions to drive your investment decision.
Core inputs and core outputs
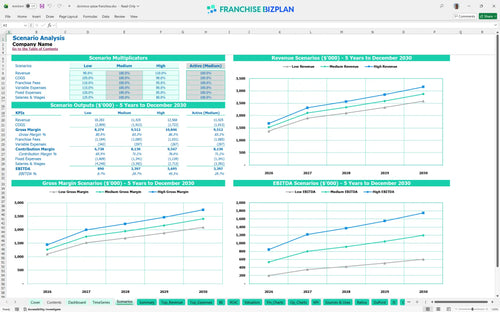
Three scenario analysis
Presentation ready
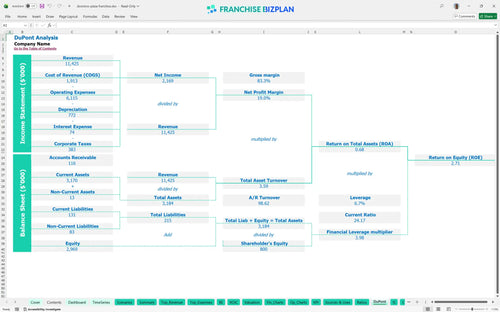
DuPont analysis
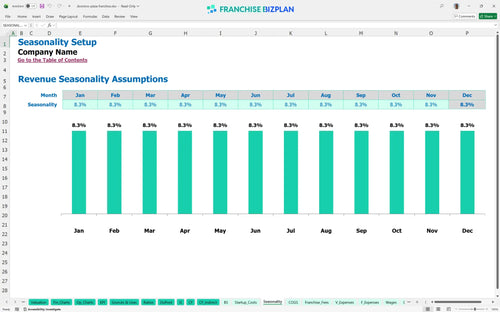
Researched revenue assumptions
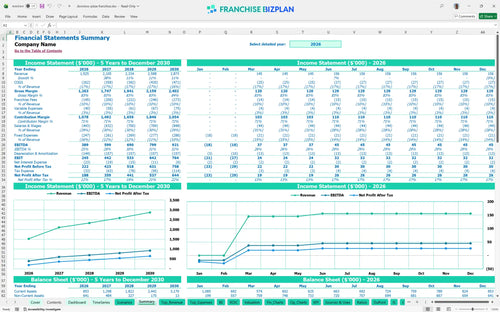
Lender-friendly financial outputs
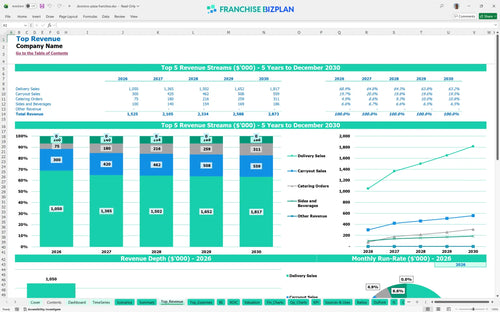
Revenue stream detailed view
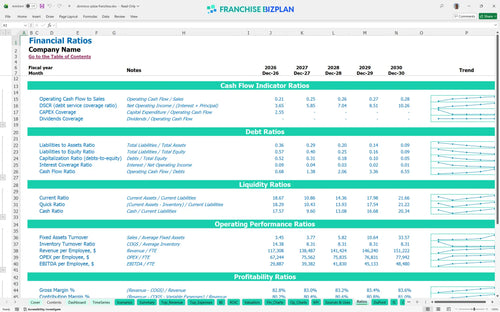
Performance metrics benchmark
We built this pizza franchise business model financial spreadsheet and financial model for fast food delivery franchise using real-world research to ensure your projections are grounded in reality. Key assumptions like the $1.5M year-one revenue and the $389k EBITDA are pre-populated but fully editable to match your specific territory. This model gives you a clear view of how calculating delivery logistics costs for franchise operations impacts your wallet.
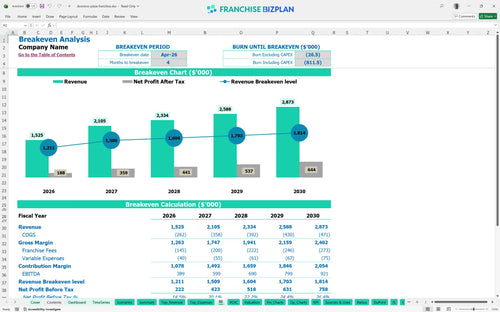
This financial feasibility study for quick service restaurant shows the unit hits its break-even date in April 2026, just four months after opening. By year two, EBITDA jumps to $599,000 as you refine your delivery routes and build local density. Here's the quick math: keeping food costs at 15% is the key to maintaining that trajectory.
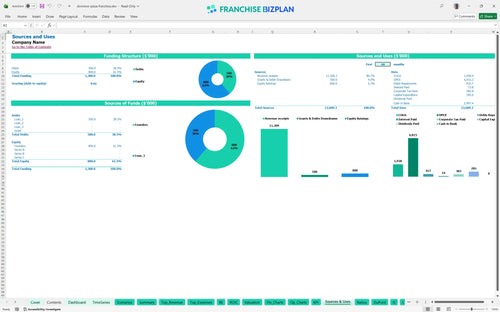
You will need a significant amount of capital to launch, with a minimum cash requirement of $468,000 by March 2026. The total initial investment covers everything from $350,000 in leasehold improvements to $220,000 for ovens and kitchen gear. This startup budget template for retail food franchise ensures you don't miss the small stuff like signage or security systems during capital expenditure planning.
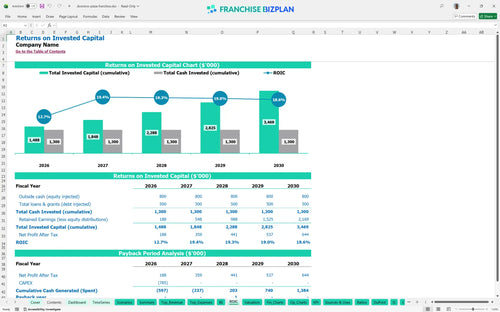
How to calculate ROI for a new pizza franchise is simple with this model, which shows a 3-year payback period and an IRR of 4.86%. While the ROE of 2.71 might seem modest, the steady cash flow growth-reaching $921k EBITDA by year five-makes it a solid long-term play. What this estimate hides is the potential for even higher returns if you can beat the 15% food cost benchmark.
Your franchise unit profit and loss template excel helps you identify that your monthly break-even depends heavily on managing the $15,000 prime location rent and the 5.5% royalty burden. You need to hit your stride by month four to stay on track with the April 2026 break-even target. The biggest lever here is defintely volume; with delivery sales projected at $700k in year one, every extra order helps cover those fixed costs faster.
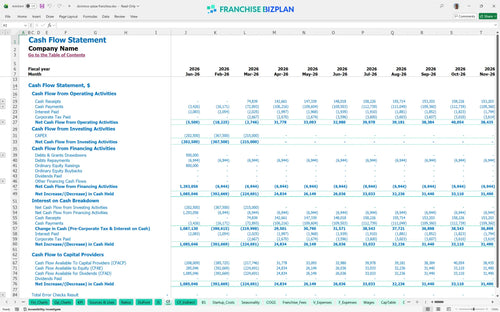
Your lowest cash point occurs in March 2026, where you'll need at least $468,000 on hand to cover the gap between build-out and ramp-up. It's smart to keep a buffer, especially since estimating labor costs for high volume pizza store operations can be tricky during the first 90 days. If your opening is delayed, that cash runway gets squeezed fast.
This franchise unit profitability analysis allows you to toggle between Low, Medium, and High scenarios to see how a 10% dip in revenue affects your year-one margin. In a high-growth scenario, forecasting revenue for pizza delivery business becomes much more exciting as fixed costs like rent stay flat while sales climb. A high-performing unit can reach that $921k EBITDA target much sooner if local marketing execution is spot on.
Finance: update unit break-even and payback model by Friday.
This pizza franchise financial model is built in Excel, so you can tweak every assumption to fit your specific market. It uses pre-filled formulas that link your revenue drivers to your bottom line, making it easy to test different store-level scenarios. Honestly, having a flexible tool is better than a static plan when rent or labor costs shift unexpectedly.

Long-term planning is about more than just next month's sales; it's about seeing the path to $2.8M in annual revenue by year five. This QSR financial forecasting model provides a detailed look at your 5-year revenue, cash flow, and operational cost projection. We map out the growth from a $1.5M year-one start to a mature unit performance, so you can see the cumulative impact of margin improvements.

The model handles the heavy lifting of calculating the franchise royalty fee structure, which is 5.5% of sales in this concept. Plus, it tracks the 4.0% marketing fund contribution to ensure your store-level EBITDA reflects the actual cash leaving the business. Understanding these obligations is vital because they represent a significant chunk of your overhead before you even pay for cheese or dough.

Use this franchise startup cost template to plan your total initial investment, which includes everything from the $10,000 franchise fee to leasehold improvements. The break-even analysis tool shows exactly what sales volume you need to cover your $15,000 monthly rent and variable costs. Knowing your floor helps you sleep better during those first few months of operation.

We included built-in benchmarks so you can compare your food ingredients cost-starting at 15.2%-against industry standards. This helps you sanity-check your restaurant franchise business plan and see if your labor or occupancy costs are out of line. If your margins look too good to be true, these benchmarks will help you find the leak.


Simply purchase and download the financial model template, then access it instantly using Microsoft Excel or Google Sheets. No installation or technical expertise required-just open and start working.

Enter your business-specific numbers, including revenue projections, costs, and investment details. The pre-built formulas will automatically calculate financial insights, saving you time and effort.

Leverage the investor-ready format to confidently showcase your financial projections to banks, franchise representatives, or investors. Impress stakeholders with clear, data-driven insights and professional reports.

Leverage the investor-ready format to confidently present your projections to banks, franchise representatives, or investors.