
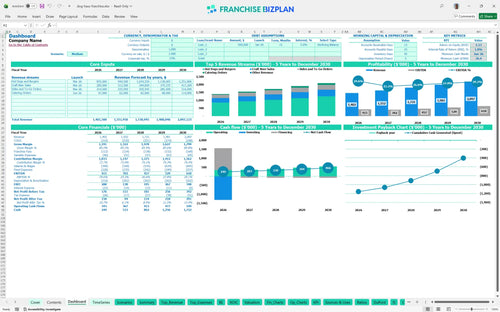
All-in-one Dashboard
Core inputs and core outputs


This Excel template for franchise unit financial projections provides a detailed franchise unit profit and loss template, cash flow statement, and CAPEX (capital expenditure) tracker designed for high-volume restaurant operations.
Core inputs and core outputs
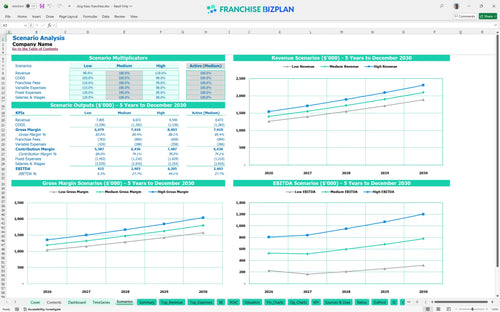
Three scenario analysis
Presentation ready
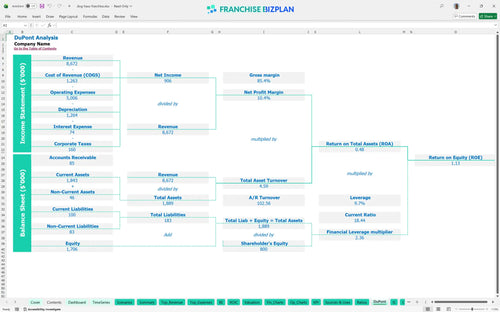
DuPont analysis
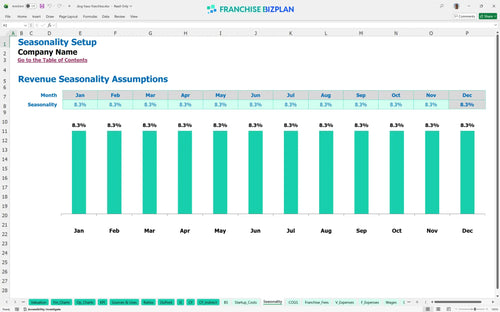
Researched revenue assumptions
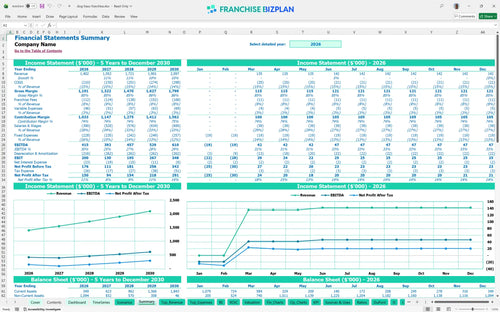
Lender-friendly financial outputs
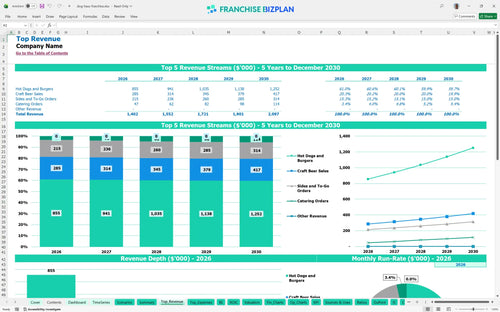
Revenue stream detailed view
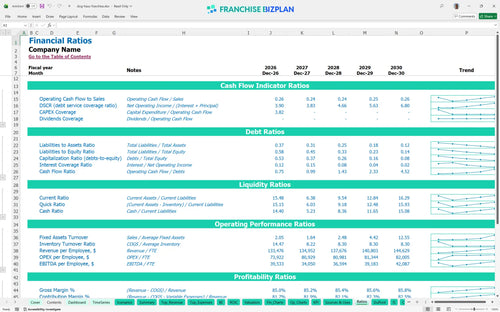
Performance metrics benchmark
We built this franchise unit financial model using our own research on gourmet fast-casual operations. Key assumptions, including the $1.4 million year-one revenue and $1.31 million in startup costs, are pre-populated and fully editable to fit your specific territory. This tool helps you map out everything from craft beer sales to patio maintenance costs with precision.
This unit reaches operational profitability in its first year, generating $415,000 in EBITDA (earnings before interest, taxes, depreciation, and amortization). While the cash flow is strong, the model shows that managing food ingredients at 13% is vital for maintaining these margins. Efficiency in the kitchen is the difference between profit and just busy work.
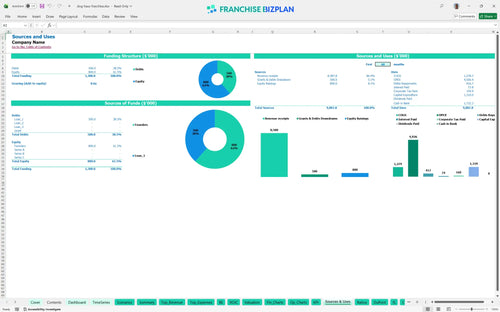
Launching this unit in the US requires $1,310,000 in capital, primarily for high-end leasehold improvements and kitchen gear. Your sources of funds must cover the $40,000 franchise fee and a $36,000 cash buffer for the ramp-up phase. Creating a budget for a new franchise location requires accounting for every single piece of patio furniture.
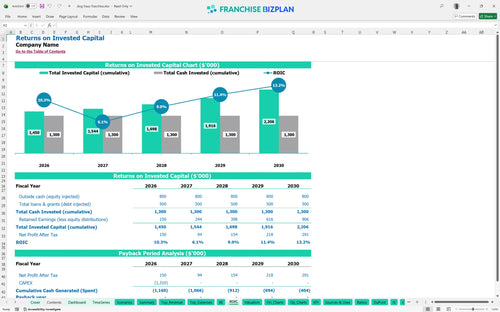
Investors can expect an Internal Rate of Return (IRR) of 1.77% and a Return on Equity (ROE) of 1.13. The payback period extends beyond five years, which is typical for a high-CAPEX build-out in a prime location. This franchise investment analysis tool for entrepreneurs shows that long-term equity is the real prize here.
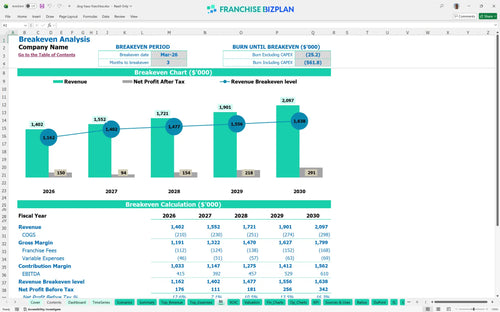
The monthly break-even point occurs in March 2026, just three months after opening. Success depends on forecasting revenue for a local restaurant franchise accurately to hit volume targets for hot dogs and burgers to offset the $12,000 monthly rent. You need to move fast to cover those fixed costs.
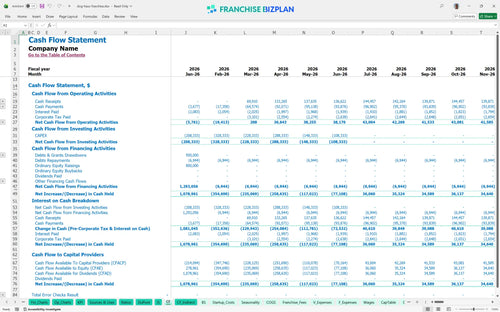
The restaurant franchise unit cash flow analysis shows the tightest point in June 2026, when the balance dips to $36,000. You must manage opening inventory and labor closely during those first 90 days to protect your liquidity. Running out of cash is defintely the biggest risk during a new store launch.
Evaluating franchise financial performance before investing requires looking at how a 10% drop in revenue affects the bottom line. Calculating profitability for a fast-casual restaurant shows that in a high-case scenario, year-five EBITDA can reach $610,000 if you maximize throughput. Your execution on the ground determines which scenario becomes your reality.
Finance: update unit break-even and payback model by Friday.
This franchise financial model template is built in Excel to give you total control over your unit-level projections. You can adjust every assumption from hourly wages to average ticket prices, ensuring the math reflects your specific market conditions rather than just a generic corporate estimate. Every 1-point margin leak matters fast in a single-unit model.

Mapping out a five-year horizon is essential for understanding how a fast-casual franchise financial forecast evolves as the brand matures. This tool tracks revenue growth from $1.4 million in year one to over $2 million by year five, helping you visualize the impact of compounding sales and rising labor costs over time. Growth is a marathon, not a sprint. This restaurant franchise business plan tool ensures you are prepared for the long haul.

The franchise royalty fee structure and brand fund contributions are hard-coded to ensure you never miss the off-the-top costs. With a 6% royalty and 2% marketing fee, you are looking at 8% of gross sales leaving the unit before you pay for a single burger bun or hour of labor. Royalties come off the top, no matter your profit.

Use the franchise startup cost calculator to account for the $1.31 million initial investment, including the $40,000 franchise fee and $650,000 for leasehold improvements. Knowing how to estimate startup costs for a restaurant franchise helps you understand that you need to hit your stride by month three to stay on track. Speed to break-even is your best insurance policy.

This model includes built-in benchmarks to help with analyzing operating margins for food service franchises. If your food ingredients cost deviates significantly from the 13% target or your $12,000 monthly rent exceeds local averages, the model flags these gaps. Benchmarks keep your assumptions honest during financial planning for new franchise owners.


Simply purchase and download the financial model template, then access it instantly using Microsoft Excel or Google Sheets. No installation or technical expertise required-just open and start working.

Enter your business-specific numbers, including revenue projections, costs, and investment details. The pre-built formulas will automatically calculate financial insights, saving you time and effort.

Leverage the investor-ready format to confidently showcase your financial projections to banks, franchise representatives, or investors. Impress stakeholders with clear, data-driven insights and professional reports.

Leverage the investor-ready format to confidently present your projections to banks, franchise representatives, or investors.