


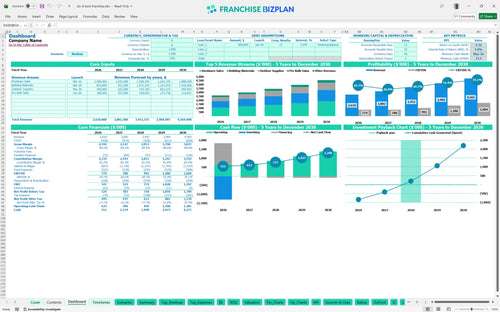
All-in-one Dashboard
Core inputs and core outputs



This franchise unit financial projection template includes everything from capital expenditure planning and retail inventory management modeling to detailed 60-month cash flow statements and break-even analysis.
Core inputs and core outputs
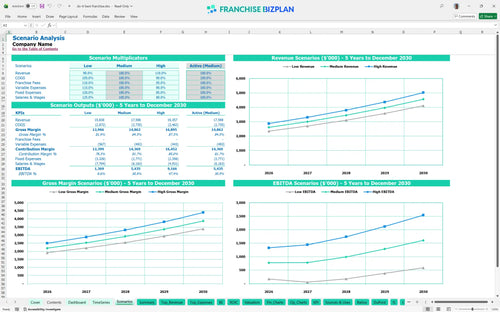
Three scenario analysis
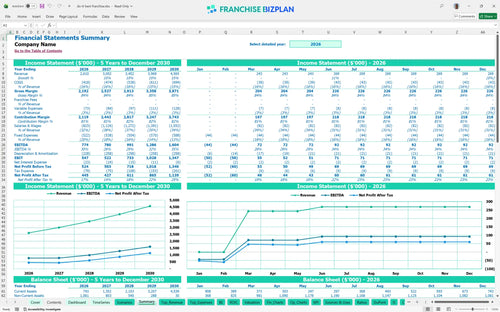
Presentation ready
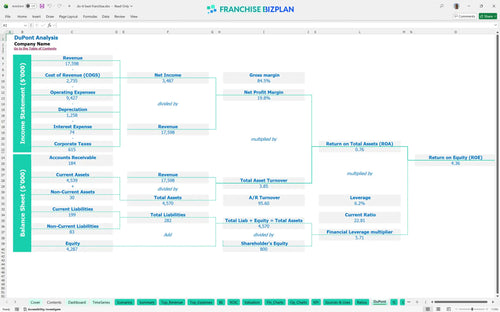
DuPont analysis
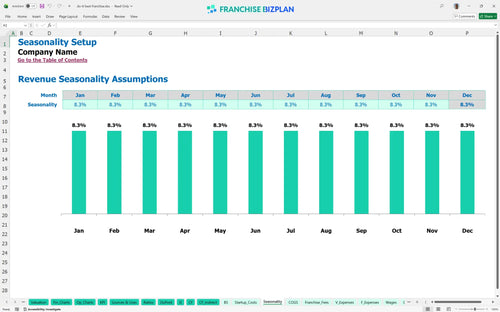
Researched revenue assumptions
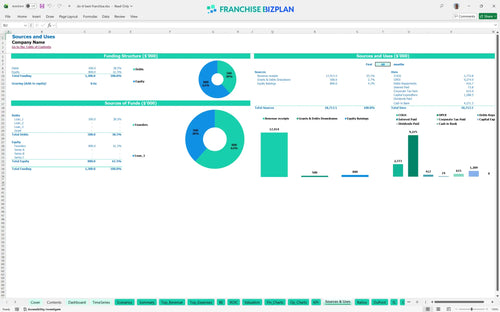
Lender-friendly financial outputs
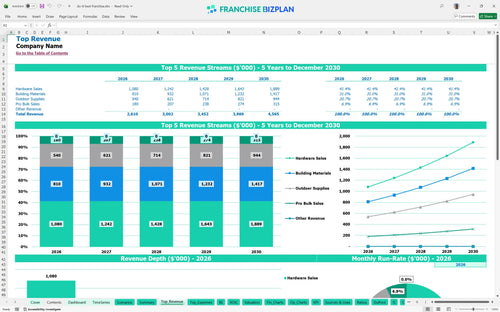
Revenue stream detailed view
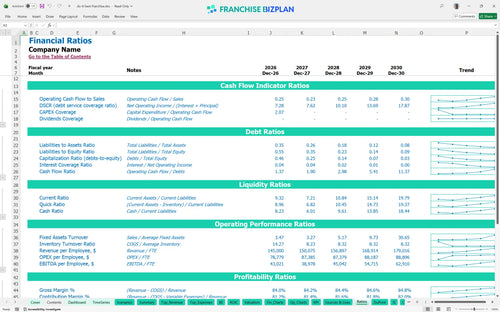
Performance metrics benchmark
We built this hardware store franchise financial model using detailed market research to ensure your projections are grounded in reality. Key assumptions like the $2.6M year-one revenue target and the $1.29M initial CAPEX are pre-populated and fully editable to match your specific territory. This tool helps you track everything from the 14% cost of goods sold to the 4-month break-even timeline so you can focus on local marketing and store operations.
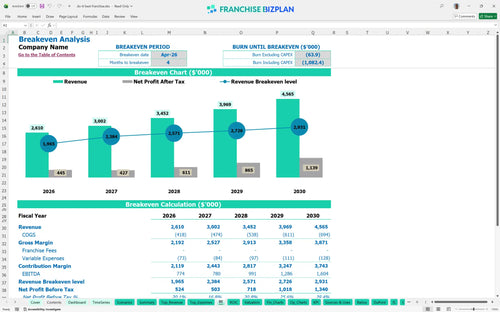
Based on the researched data, this unit hits profitability remarkably fast, reaching break-even by April 2026, just four months after launching. With year-one EBITDA starting at $774,000 and scaling to $1.6M by year five, the store-level margin stays healthy as long as you manage the 14% COGS and the $1.3M startup hurdle. Here's the quick math: high volume and low royalties make for a fast ramp-up.
To get the doors open, you'll need a total initial investment of roughly $1.29M. This covers the $600,000 in leasehold improvements and $300,000 for shelving and fixtures, which are the biggest cash outlays before you even sell a single hammer. You also need to budget $100,000 for initial display inventory to ensure the store looks full on opening day. Startup costs are the biggest barrier to entry in this segment.
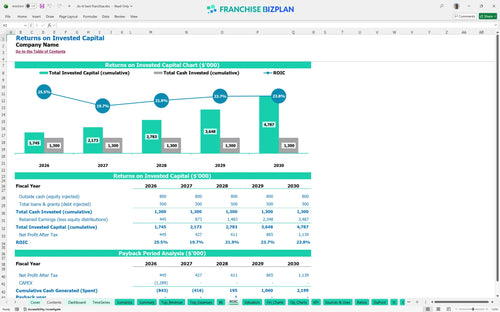
Calculating ROI for hardware franchise investment shows a steady 3-year payback period for the initial $1.29M outlay. While the IRR is 4.92% and ROE is 4.36, the real value is in the long-term cash flow, with EBITDA nearly doubling between year two and year five as the local market matures. What this estimate hides is the potential for even higher returns if you can lower freight costs below 2%.
You reach the monthly break-even point in April 2026, only four months after opening. The biggest driver for this is hardware sales volume, which needs to hit its stride early to cover the $25,000 monthly rent and the $15,000+ monthly manager and assistant manager salaries. If opening takes 90+ days longer than planned, working capital pressure rises defintely fast.
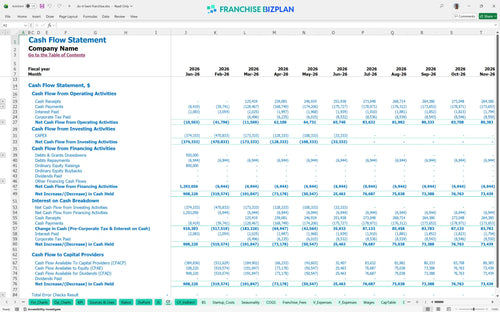
Your lowest cash point is $73,000 in May 2026, just as the initial ramp-up begins to stabilize. It's a bit tight, so having an additional cash buffer is recommended if leasehold improvements run over budget or if the $100,000 initial inventory doesn't turn as fast as planned. Still, the quick 4-month path to break-even minimizes the time you are burning through capital.
Financial forecasting for retail franchise locations must account for volatility in local construction and DIY demand. In a high-growth scenario where revenue exceeds the $2.6M year-one target, your 3-year payback could accelerate, but a low-revenue year might push that lowest cash point of $73,000 into the red. Scenario planning helps you decide when to hire that extra assistant manager or delay a workshop lead.
A hardware store franchise financial model needs to be flexible because every territory has different labor rates and supply chain costs. This Excel-based tool lets you tweak every assumption, from local wages for your ten sales associates to specific product mix, ensuring your hardware store business plan Excel stays accurate for your specific market. Every formula is open, so you can adjust the 14% cost of goods sold (COGS) if your local freight costs fluctuate. Precision in the planning phase prevents expensive surprises during the first year of operations.

Planning for a retail franchise startup cost analysis requires a long-term view of how local demand scales over time. This model provides detailed 5-year projections, showing revenue growing from $2.61M in year one to $4.56M by year five as you capture more of the local homeowner market. It tracks the ramp-up of hardware sales, building materials, and pro-bulk sales to ensure your cash flow supports growth. Long-term success in hardware depends on steady inventory turns and managing the gradual increase in staffing needs.

While some models have heavy ongoing fees, this hardware store franchise financial model Excel template accounts for the specific co-op structure where royalties and marketing fees are often zeroed out. You can still track the initial $8,500 franchise fee and ongoing local marketing spend of $2,000 per month to see the true store-level margin. Understanding these obligations is vital for calculating your actual take-home pay after the co-op requirements are met. Every dollar saved on royalties is a dollar you can reinvest in local inventory or staff training.

Estimating operating expenses for a home improvement store is critical when your initial investment hits nearly $1.3M. This tool provides a clear break-even analysis, showing exactly when your monthly sales cover the $25,000 rent and the $41,000+ in monthly fixed overhead. Knowing your break-even point helps you set realistic sales targets for your assistant manager and sales team from day one. If you don't know your nut, you can't manage your margin.

Use this franchise profitability analysis spreadsheet to sanity-check your labor and COGS against industry standards. If your cost of goods sold is hitting 14% while your peers are lower, the model flags where you need to tighten retail inventory management modeling. These benchmarks act as a guardrail, helping you identify if your $90,000 manager salary or $25,000 rent is out of line with typical hardware store economics. Benchmarks turn raw data into a competitive advantage.


Simply purchase and download the financial model template, then access it instantly using Microsoft Excel or Google Sheets. No installation or technical expertise required-just open and start working.

Enter your business-specific numbers, including revenue projections, costs, and investment details. The pre-built formulas will automatically calculate financial insights, saving you time and effort.

Leverage the investor-ready format to confidently showcase your financial projections to banks, franchise representatives, or investors. Impress stakeholders with clear, data-driven insights and professional reports.

Leverage the investor-ready format to confidently present your projections to banks, franchise representatives, or investors.