
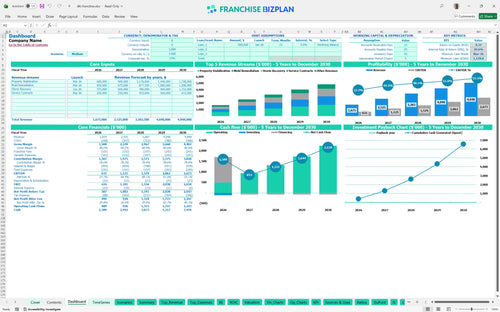
All-in-one Dashboard
Core inputs and core outputs


This is the complete toolkit for restoration unit planning, featuring integrated financial statements and specialized restoration revenue drivers.
Core inputs and core outputs
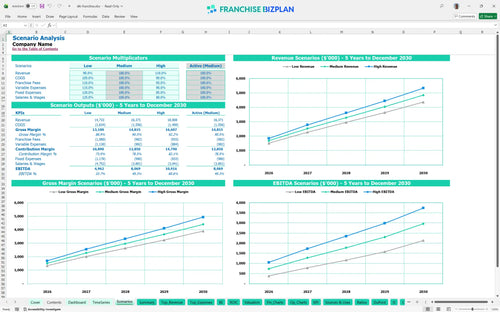
Three scenario analysis
Presentation ready
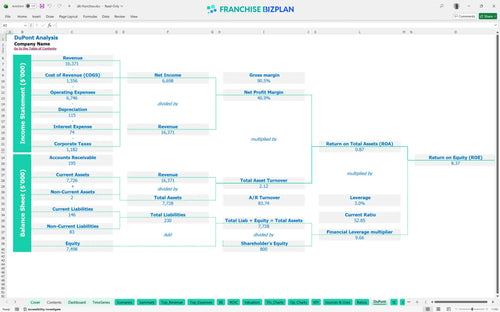
DuPont analysis
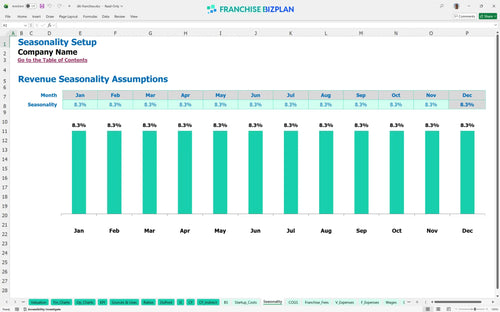
Researched revenue assumptions
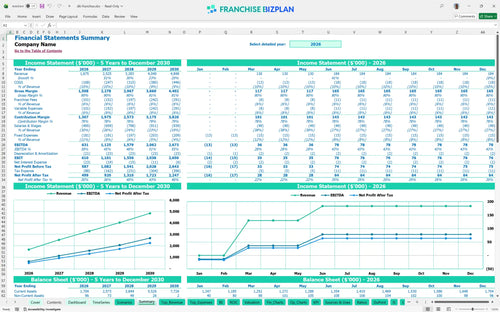
Lender-friendly financial outputs
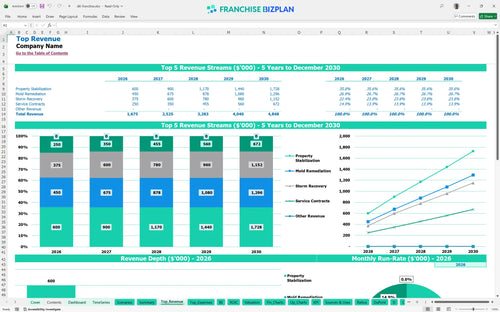
Revenue stream detailed view
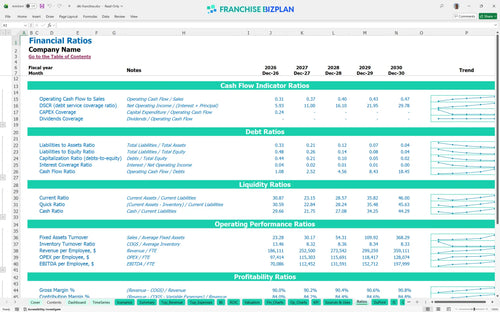
Performance metrics benchmark
We built this financial model for property restoration franchise units using detailed research into the disaster recovery sector. Key assumptions, including $1.67 million in year-one revenue and specific restoration chemical costs, are pre-populated and fully editable to match your local market. Data-driven decisions beat gut feelings every time.
Analyzing profitability of disaster recovery franchise units shows this model reaches positive net profit in year one, specifically by March 2026. After accounting for a 6% royalty and fixed costs like the $8,500 monthly rent, the unit scales to an EBITDA of $2.67 million by year five.
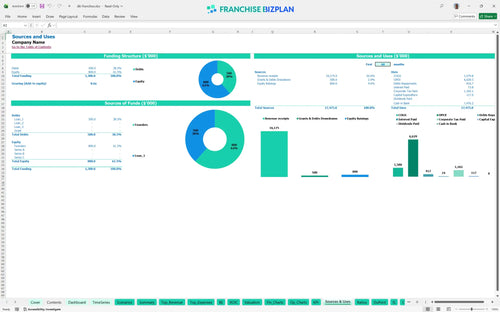
Restoration business startup costs total $117,000 for hard assets, but you need a total cash position of $1.17 million to handle the ramp-up and working capital. This covers the $5,000 franchise fee, $40,000 in leasehold improvements, and specialized equipment. Your initial check is just the beginning of the capital story.
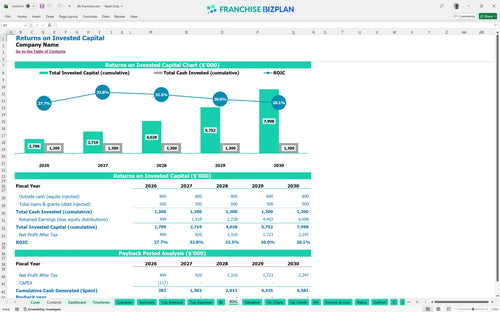
The ROI analysis indicates an internal rate of return of 29.62% and a return on equity of 8.37. While the unit generates strong EBITDA, the high initial cash requirement means the full payback occurs after year five, though you will defintely see strong annual cash yields before then.
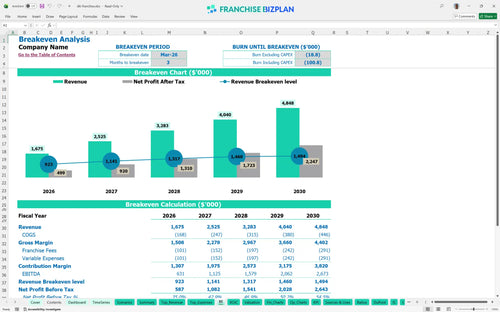
Calculating break-even point for restoration franchise units reveals a three-month ramp-up, hitting the mark in March 2026. With year-one sales projected at $1.67 million, you need roughly $140,000 in monthly revenue to cover fixed facility costs and variable fleet expenses. Three months to break-even is an aggressive but doable target.
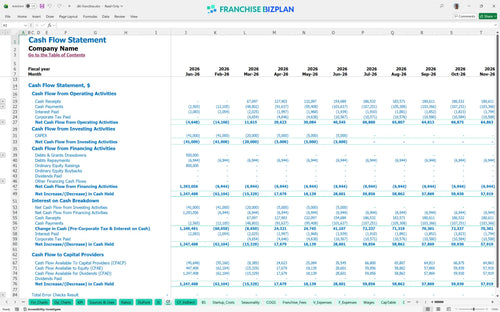
The franchise unit performance tracking spreadsheet identifies March 2026 as the lowest cash point at $1.17 million. You need a significant runway to manage the gap between performing emergency services and receiving insurance claim payouts. Cash is king when you are waiting on insurance payouts.
A financial feasibility study for restoration franchise startup shows that hitting the high case depends on scaling revenue from $1.67 million to $4.84 million. Low scenarios with higher chemical costs or slower B2B referral growth can delay profitability and increase the peak cash need. High-performance units focus on B2B referral consistency.
Finance: update unit break-even and payback model by Friday.
This franchise financial model template is a professional-grade Excel tool designed for precision and flexibility. It features pre-filled formulas and editable assumptions, allowing you to adjust revenue drivers, local labor rates, and rent to fit your specific territory and market conditions. Control your numbers before you sign the lease.

Plan for the long game with five years of visibility into your restoration business. This model provides detailed forecasts for revenue, expenses, and cash flow, helping you visualize the growth from a single unit into a mature operation. It is one of the best financial planning tools for new franchisees looking to map out long-term sustainability.

This tool simplifies the complex math of franchise-specific obligations by automating the calculation of initial fees and ongoing royalties. By modeling a 6% royalty against your projected top line, you can see exactly how brand costs impact your store-level margin. Royalties are a top-line hit you must model accurately.

Estimating operating expenses for restoration business units is critical to avoiding early cash crunches. The model helps you aggregate everything from leasehold improvements to initial inventory, providing a clear picture of the total investment needed. Know exactly when the bleeding stops.

The model includes restoration business profit margin benchmarks to help you sanity-check your projections against industry standards. Compare your chemical costs and labor percentages to ensure your unit economics remain competitive and realistic for the disaster recovery sector. Don't guess on labor; use industry standards.


Simply purchase and download the financial model template, then access it instantly using Microsoft Excel or Google Sheets. No installation or technical expertise required-just open and start working.

Enter your business-specific numbers, including revenue projections, costs, and investment details. The pre-built formulas will automatically calculate financial insights, saving you time and effort.

Leverage the investor-ready format to confidently showcase your financial projections to banks, franchise representatives, or investors. Impress stakeholders with clear, data-driven insights and professional reports.

Leverage the investor-ready format to confidently present your projections to banks, franchise representatives, or investors.