
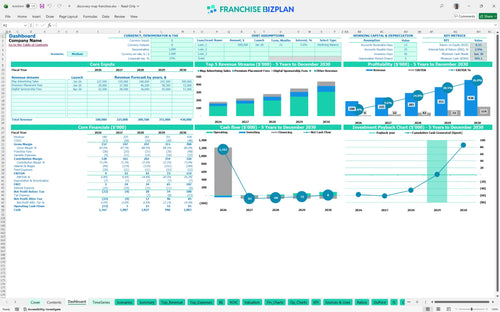
All-in-one Dashboard
Core inputs and core outputs


This Excel template for franchise unit financial forecasting provides a complete operating budget spreadsheet with integrated P&L, cash flow, and capital expenditure planning tools.
Core inputs and core outputs
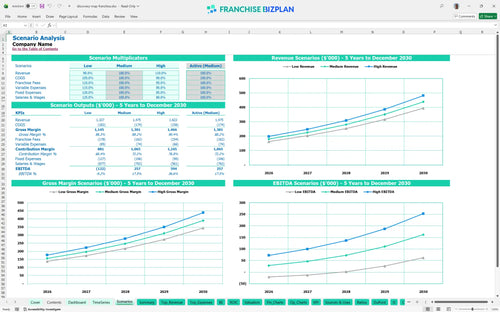
Three scenario analysis
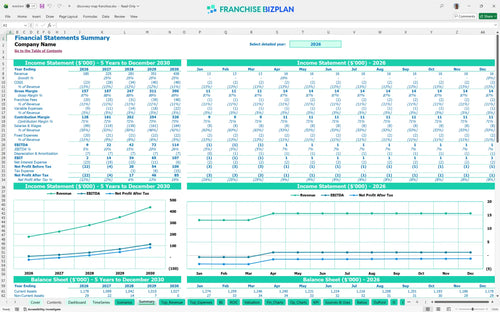
Presentation ready
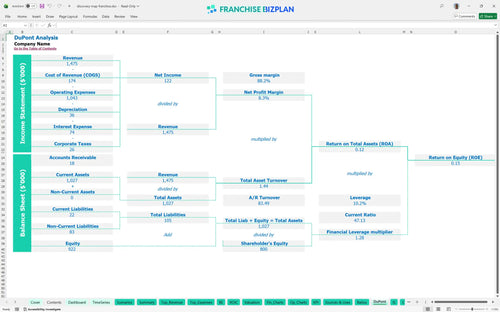
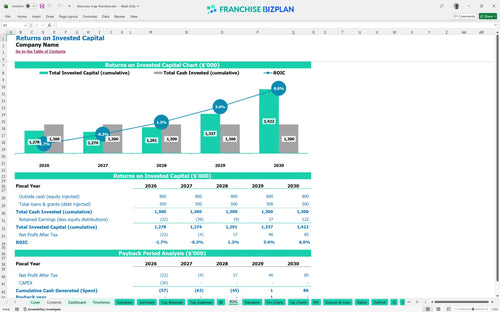
DuPont analysis
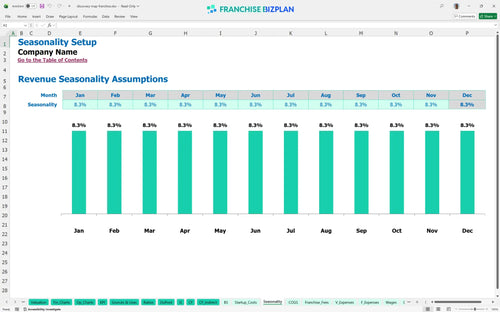
Researched revenue assumptions
Lender-friendly financial outputs
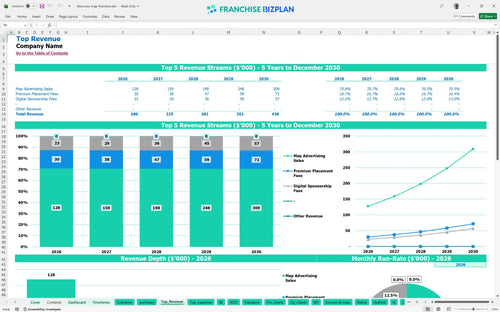
Revenue stream detailed view
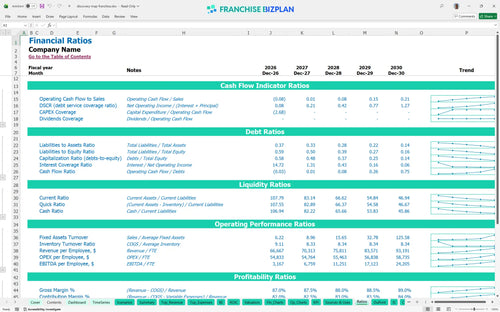
Performance metrics benchmark
We built this franchise unit financial model using our own research into local advertising and tourism map operations. Key assumptions, including the $180,000 year-one revenue and the 11% total royalty and marketing burden, are pre-populated with researched data and are fully editable. This tool simplifies estimating advertising revenue for local tourism business while keeping your capital expenditure planning precise.
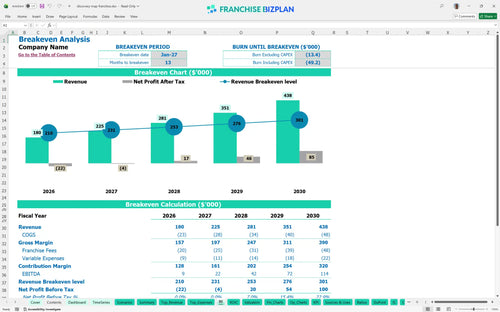
The unit is projected to reach profitability in January 2027, exactly 13 months after launch. By year five, you should see an EBITDA of $114,000 as you scale map advertising and digital sponsorship fees. This franchise profitability analysis shows a steady climb from a $9,000 profit in your first year. Time is money, and 13 months is a fast ramp for this industry.
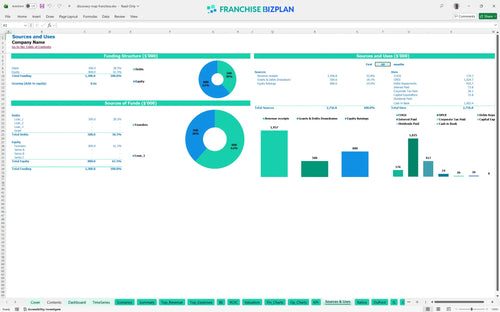
You need approximately $35,800 to launch, which covers the $25,000 franchise fee and $10,800 in equipment and setup costs. This model helps you understand how to calculate startup costs for a franchise unit by detailing every expense from display racks to digital platform setup. Cash is king, especially when your biggest check is the one you write on day one.
The ROI calculation shows an Internal Rate of Return (IRR) of 2.89% and a 4-year payback period on your initial investment. While the early returns are conservative, the model demonstrates a 0.15 Return on Equity as the business matures. A 4-year payback means you're playing the long game for local dominance.
Monthly break-even is achieved when revenue hits roughly $14,000 to cover your $1,660 fixed costs and variable map production expenses. The primary driver for reaching this point is the volume of map advertising sales and maintaining your 3.8% sales commission structure. Break-even is a milestone, not a destination.
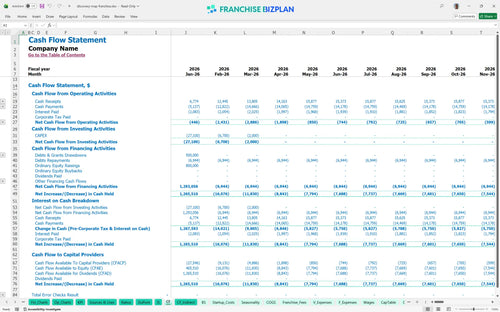
Your franchise unit cash flow projection spreadsheet indicates the lowest cash point occurs in January 2030 at $995,000, assuming high capital retention. You should maintain a healthy buffer during the first year to manage the gap between printing costs and advertiser collections. Watch your runway like a hawk during the first winter.
The high scenario significantly accelerates your payback by leveraging the fixed $40,000 sales manager salary against higher volume. Planning recurring revenue for advertising business model success requires looking at how a 10% revenue drop impacts your year-1 $9,000 EBITDA. Scenarios aren't just math; they are your map for survival.
This franchise financial model template is a flexible Excel tool that lets you adjust every variable to fit your specific territory and market conditions. You can easily modify the pre-filled formulas and editable assumptions to see how changes in local ad rates or sales commissions affect your small business financial projection spreadsheet. Every 1-point margin leak matters fast in a single-unit model.

Planning for long-term growth is simpler with detailed 5-year projections that track your evolution from a $180,000 startup to a $438,000 mature operation. This revenue stream analysis helps you visualize the transition from initial launch to a stable, profitable franchise business plan template. A 5-year view turns a job into a scalable asset.

This model accurately captures your ongoing financial obligations, including the 10% royalty and 1% brand marketing fund contributions. By tracking these franchise royalty fees against your gross sales, you can maintain a clear picture of your store-level margin after the franchisor takes their cut. Knowing your real take-home pay prevents nasty surprises at tax time.

Our franchise startup cost calculator helps you map out the initial $35,800 investment, including the $25,000 franchise fee and essential map display racks. You will also get a clear franchise unit break-even analysis template to determine exactly when your ad sales will cover the $1,660 in monthly fixed overhead. Knowing your number is the first step to sleeping better at night.

We defintely included industry benchmarks for labor and printing costs so you can sanity-check your assumptions against typical performance ranges. This allows for a realistic financial feasibility study for new franchise owners, ensuring your 11.5% printing cost estimate aligns with the broader service-based franchise startup landscape. Benchmarks keep your projections from becoming pure fiction.


Simply purchase and download the financial model template, then access it instantly using Microsoft Excel or Google Sheets. No installation or technical expertise required-just open and start working.

Enter your business-specific numbers, including revenue projections, costs, and investment details. The pre-built formulas will automatically calculate financial insights, saving you time and effort.

Leverage the investor-ready format to confidently showcase your financial projections to banks, franchise representatives, or investors. Impress stakeholders with clear, data-driven insights and professional reports.

Leverage the investor-ready format to confidently present your projections to banks, franchise representatives, or investors.